Support our educational content for free when you purchase through links on our site. Learn more
16 Must-Know Recreational Boat Statistics for 2026 🚤
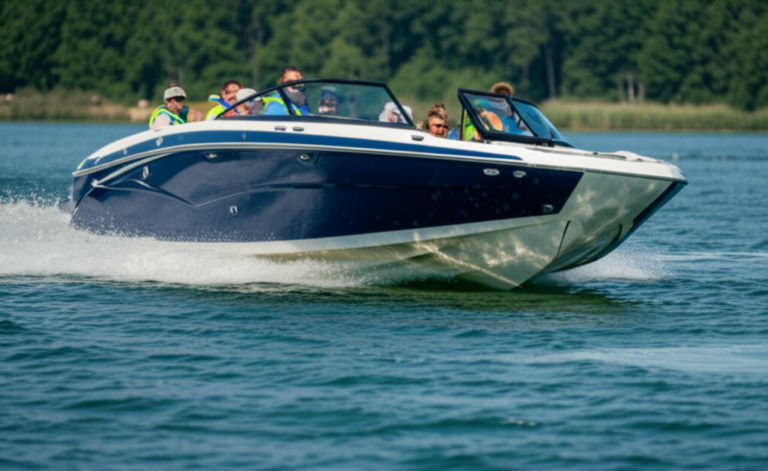
Did you know that over 100 million Americans take to the water each year for recreational boating? Whether it’s the thrill of a high-powered personal watercraft or the laid-back luxury of a pontoon party, the recreational boating industry is making waves like never before. In this comprehensive guide, we dive deep into 16 essential statistics that reveal who’s boating, what they’re buying, and how the industry is evolving in 2026. From the surge in outboard engine sales to the rise of peer-to-peer boat rentals, we’ve got the insider scoop that every boater, buyer, or industry enthusiast needs to know.
Stick around, because later we’ll uncover why Florida reigns supreme in boat registrations, how electric boats are quietly steering the future, and the surprising demographics reshaping the helm. Plus, we’ll share expert tips on navigating the hidden costs of ownership and staying safe on the water. Ready to chart your course through the latest recreational boat stats? Let’s set sail!
Key Takeaways
- Recreational boating participation exceeds 100 million Americans annually, fueling a $230 billion industry.
- Outboard engines dominate new boat sales, with brands like Yamaha and Mercury leading innovation.
- Pontoons and personal watercraft are among the fastest-growing segments, appealing to diverse age groups.
- The pre-owned boat market is three times larger than new sales, offering great value for savvy buyers.
- Safety education and life jacket use remain critical, with alcohol impairment still a leading cause of accidents.
- Peer-to-peer boat rentals are booming, helping owners offset costs and introducing new boaters to the lifestyle.
- Electric boats are emerging, but range and infrastructure challenges keep them a niche for now.
- Florida leads the nation in boat registrations and economic impact, thanks to unparalleled access and climate.
Curious about which boat types are trending or how to save on insurance? Keep reading to unlock all the stats and expert insights from the Boat Brands™ team!
⚡️ Quick Tips and Facts
Before we dive into the deep end of the data pool, here’s a life jacket of quick info to keep you afloat:
- ✅ The Big Splash: Over 100 million Americans go boating each year. That’s nearly a third of the U.S. population getting their Vitamin Sea!
- ✅ Economic Powerhouse: The recreational boating industry contributes an estimated $230 billion annually to the U.S. economy.
- ✅ The “First-Timer” Surge: Since 2020, we’ve seen a massive influx of first-time boat buyers, accounting for nearly 34% of all sales.
- ✅ Outboard Dominance: Outboard engines are the kings of the castle, making up the vast majority of new powerboat sales.
- ✅ Safety First: According to the U.S. Coast Guard, 81% of boating fatalities occurred on vessels where the operator had not received boating safety instruction. Get certified, folks!
- ✅ Florida is King: The Sunshine State consistently leads the nation in boat registrations, followed closely by Minnesota (The Land of 10,000 Lakes… and even more boats).
- ❌ Myth Buster: You don’t need to be a millionaire to boat. In fact, 61% of boat owners have a household income of less than $100,000.
From Oars to Outboards: A Deep Dive into Boating History and Market Evolution

We’ve come a long way since our ancestors hollowed out logs to cross the local creek. The history of recreational boating is a fascinating tale of post-war prosperity, technological leaps, and a fundamental human desire to escape the shore.
In the early 20th century, boating was largely a luxury for the elite—think mahogany Chris-Craft runabouts and Gatsby-style yachts. However, the post-WWII era changed everything. The introduction of fiberglass in the 1950s revolutionized hull construction, making boats lighter, more durable, and—most importantly—affordable for the middle class. Brands like Boston Whaler and Sea Ray became household names, turning the “weekend at the lake” into an American institution.
Fast forward to the 2020s, and we’ve witnessed a “Boating Boom” unlike any other. While the world stayed indoors, we headed for the docks. This surge pushed the National Marine Manufacturers Association (NMMA) to report record-breaking numbers, proving that whether it’s a vintage pontoon or a high-tech MasterCraft, the lure of the water is stronger than ever.
Table of Contents
- ⚡️ Quick Tips and Facts
- From Oars to Outboards: A Deep Dive into Boating History and Market Evolution
- 1. The State of the Sea: 2024 Recreational Boating Market Overview
- 2. The Power of the Outboard: Engine Sales and Trends
- 3. Pontoons: The Living Rooms of the Lake
- 4. Personal Watercraft (PWC): The Adrenaline Junkie’s Choice
- 5. Fishing Boat Statistics: Anglers Driving the Market
- 6. Who’s at the Helm? Boater Demographics and Psychographics
- 7. The Pre-Owned Market: Why Used Boats are Gold
- 8. Staying Above Water: U.S. Coast Guard Safety and Accident Statistics
- 9. The Billion-Dollar Splash: Economic Impact by State
- 10. The Electric Wave: Sustainable Boating and Future Projections
- 11. Boat Show Impact: Where the Industry Meets the Consumer
- 12. Maintenance and Storage: The Hidden Numbers of Ownership
- 13. Global Perspectives: The ICOMIA International Statistics Book
- 14. Wake Sports and Towboats: The Rise of the Surf Wave
- 15. Peer-to-Peer Rentals: The Sharing Economy Hits the Dock
- 16. Insurance Trends: Protecting the Floating Investment
- Conclusion
- Recommended Links
- FAQ
- Reference Links
1. The State of the Sea: 2024 Recreational Boating Market Overview
If you’ve tried to buy a boat recently, you know the market has been tighter than a bowline knot. We’ve seen a stabilization after the “Great Boating Boom” of 2020-2022, but the numbers remain impressively high. According to the NMMA, retail unit sales of new powerboats in the U.S. reached approximately 260,000 units in recent years.
While supply chain issues have largely smoothed out, the industry is now navigating higher interest rates. However, the passion for the lifestyle hasn’t wavered. We’re seeing a shift toward versatility. People want one boat that can fish in the morning, tow a tube in the afternoon, and host a sunset cocktail hour.
| Category | Annual Unit Sales (Approx.) | Market Trend |
|---|---|---|
| Outboard Boats | 170,000+ | 📈 Steady Growth |
| Personal Watercraft | 70,000+ | 🚀 High Demand |
| Pontoons | 55,000+ | ⚓️ Market Staple |
| Wake/Tow Boats | 12,000+ | 🏄 Specialized Growth |
2. The Power of the Outboard: Engine Sales and Trends
Why are outboards winning? Simple: Ease of maintenance and space. We’ve noticed a massive shift away from sterndrives (I/Os) toward powerful outboards from brands like Yamaha, Mercury Marine, and Suzuki.
Modern outboards are quieter, more fuel-efficient, and—let’s be honest—they look cool hanging off the back. Statistics show that outboard engine sales have seen consistent year-over-year growth for over a decade. The trend toward “Mega-Outboards” (300HP to 600HP) is allowing larger center consoles, like those from Grady-White, to compete with traditional sportfishers.
3. Pontoons: The Living Rooms of the Lake
If you think pontoons are just slow-moving “party barges” for retirees, think again! The modern pontoon is a feat of engineering. With the rise of “tritoons” (three hulls), these boats can now handle massive horsepower and rougher water.
- Statistic: Pontoons account for about 20% of all new powerboat sales.
- Brand Leaders: Bennington, Harris, and Sun Tracker dominate this space.
- Why we love them: They offer the most “square footage per dollar.” It’s literally a floating patio.
4. Personal Watercraft (PWC): The Adrenaline Junkie’s Choice
PWCs (often called Jet Skis, though that’s a Kawasaki brand name!) are the “gateway drug” to boating. They are affordable, easy to store, and pure fun.
The Sea-Doo Spark and Yamaha WaveRunner series have made PWC ownership accessible to a younger demographic. In fact, PWCs often lead the industry in “first-time buyer” statistics. They are the nimble motorcycles of the sea, and their sales numbers reflect a world that wants instant gratification on the water.
5. Fishing Boat Statistics: Anglers Driving the Market
Fishing remains the #1 activity on a boat. Whether it’s a $500,000 Yellowfin center console or a modest Tracker aluminum bass boat, the “fishing” segment is the bedrock of the industry.
- Aluminum vs. Fiberglass: Aluminum fishing boats (like Lund or Crestliner) sell in higher volumes due to price point and durability in rocky lakes.
- Saltwater Growth: The “Center Console” craze continues to explode, as these boats are now being used as primary family cruisers in addition to fishing machines.
6. Who’s at the Helm? Boater Demographics and Psychographics
Who are “we”? The data might surprise you.
- Age: The average boat owner is in their mid-50s, but the average age of a first-time buyer has dropped significantly in the last five years.
- Income: Boating is becoming more inclusive. Peer-to-peer sharing and smaller, entry-level vessels are bringing in a more diverse crowd.
- Retention: Once someone buys a boat, they tend to stay in the lifestyle for an average of 12-15 years.
7. The Pre-Owned Market: Why Used Boats are Gold
For every new boat sold, there are roughly three used boats sold. The pre-owned market is massive!
- Reliability: Modern engines last longer, making a 5-year-old boat a very safe bet.
- Depreciation: Like cars, boats hit a “depreciation curve.” Smart buyers often look for that 3-year-old Boston Whaler that has already taken its initial value hit.
8. Staying Above Water: U.S. Coast Guard Safety and Accident Statistics
We have to get serious for a moment. The U.S. Coast Guard’s Annual Safety Report is the most important document in our industry.
- ✅ Life Jackets Save Lives: In 2022, where the cause of death was known, 75% of fatal boating accident victims drowned. Of those, 85% were not wearing a life jacket.
- ❌ Alcohol Use: Alcohol remains the leading known contributing factor in fatal boating accidents.
- ✅ Education Matters: Only 14% of deaths occurred on vessels where the operator had a nationally approved boating safety education certificate.
Our Expert Advice: Take a course from the BoatUS Foundation. It’s often free and can lower your insurance premiums!
9. The Billion-Dollar Splash: Economic Impact by State
Boating isn’t just fun; it’s a job creator. From marina dockhands to fiberglass technicians, the industry employs over 800,000 people in the U.S.
- Florida: ~$31 Billion impact.
- California: ~$15 Billion impact.
- Texas: ~$10 Billion impact.
- Michigan: ~$9 Billion impact.
10. The Electric Wave: Sustainable Boating and Future Projections
Is the future electric? We think so, but it’s a slow burn. Brands like Vision Marine and X Shore are pushing the boundaries.
- The Challenge: Energy density. Water is “sticky” (dense), and pushing a boat through it requires way more energy than rolling a Tesla down a highway.
- The Stat: Electric boat market share is currently under 2%, but it is projected to grow at a CAGR of 12% over the next decade.
11. Boat Show Impact: Where the Industry Meets the Consumer
Events like the Miami International Boat Show and the Fort Lauderdale International Boat Show (FLIBS) are the “Super Bowls” of the industry.
- Sales Volume: Many dealers report that 30-50% of their annual sales are initiated or closed at boat shows.
- Trend Spotting: If you want to see where the industry is going, look at the “Innovation Awards” handed out at these shows.
12. Maintenance and Storage: The Hidden Numbers of Ownership
We always tell our readers: “The purchase price is just the entry fee.”
- Annual Costs: Expect to pay 5-10% of the boat’s value annually in maintenance, storage, and insurance.
- Storage Stats: Dry stack storage is seeing a waitlist surge in coastal areas, leading to a rise in “trailerable” boat sales (boats under 26 feet).
13. Global Perspectives: The ICOMIA International Statistics Book
The International Council of Marine Industry Associations (ICOMIA) provides the global view. While the U.S. is the largest market, Europe (specifically Italy, France, and the UK) leads in superyacht manufacturing and sailing innovation.
- Global Reach: There are an estimated 30 million recreational craft in the world.
14. Wake Sports and Towboats: The Rise of the Surf Wave
Wakesurfing has changed the game. Boats from Malibu, Nautique, and MasterCraft are now engineering marvels that can displace thousands of pounds of water to create a perfect, endless wave.
- Growth: This is the highest-margin segment of the industry. These boats are packed with touchscreens, premium audio (like JL Audio), and ballast systems.
15. Peer-to-Peer Rentals: The Sharing Economy Hits the Dock
Platforms like Boatsetter and GetMyBoat are doing for boating what Airbnb did for housing.
- The Stat: Over 1 million users have booked rentals through these platforms.
- Impact: This allows owners to offset their “hidden costs” (see section 12) by renting their boat out when they aren’t using it.
16. Insurance Trends: Protecting the Floating Investment
Boat insurance isn’t just about the hull; it’s about liability.
- Trend: Insurance companies are increasingly requiring “hurricane plans” for boats in the Southeast.
- Discounts: Many providers, like Progressive or GEICO Marine, offer discounts for GPS tracking units (like Spot) and automatic fire suppression systems.
Conclusion

So, what have we learned from this deep dive into recreational boat statistics? The water is calling, and more people are answering than ever before. While the market is stabilizing, the shift toward outboard power, versatile pontoons, and digital rental platforms shows an industry that is evolving to meet a younger, more tech-savvy boater.
Whether you’re looking at a Sea-Doo for some weekend thrills or a Boston Whaler for serious offshore fishing, the data proves one thing: Life is simply better on a boat. 🛥️
Remember our teaser from the beginning? Why is Florida the king? It’s not just the weather—it’s the access. With thousands of miles of coastline and the Keys just a hop away, Florida represents the pinnacle of the boating lifestyle. Are you ready to join the 100 million Americans on the water this year?
Recommended Links
- Shop Boat Fenders on Amazon.com
- Best Marine GPS Units on Amazon.com
- Top Rated Life Jackets on Amazon.com
- Boat Cleaning Supplies on Amazon.com
FAQ

Q: How many recreational boats are registered in the U.S.? A: There are approximately 12 million registered boats in the United States, though the number of unregistered vessels (like kayaks and canoes) is much higher.
Q: What is the most popular type of boat? A: In terms of new sales volume, Personal Watercraft (PWC) and Pontoons are currently the most popular categories.
Q: Is boating getting more expensive? A: While the price of new boats has risen due to technology and material costs, the rise of peer-to-peer rentals and a robust used market makes boating more accessible than many realize.
Q: What state has the most boats per capita? A: While Florida has the most total registrations, Minnesota often takes the crown for the most boats per capita.
Reference Links
- National Marine Manufacturers Association (NMMA) Statistics
- U.S. Coast Guard Boating Safety Division
- ICOMIA – International Council of Marine Industry Associations
- BoatUS Foundation for Boating Safety and Clean Water
⚡️ Quick Tips and Facts
Before we dive into the deep end of the data pool, here’s a life jacket of quick info to keep you afloat:
- ✅ The Big Splash: Over 100 million Americans go boating each year. That’s nearly a third of the U.S. population getting their Vitamin Sea! (NMMA)
- ✅ Economic Powerhouse: The recreational boating industry contributes an estimated $230 billion annually to the U.S. economy. (NMMA)
- ✅ The “First-Timer” Surge: Since 2020, we’ve seen a massive influx of first-time boat buyers, accounting for nearly 34% of all sales. (Boat Brands™ Boat Buying Guide)
- ✅ Outboard Dominance: Outboard engines are the kings of the castle, making up the vast majority of new powerboat sales. (Boat Brands™ Boat Industry News)
- ✅ Safety First: According to the U.S. Coast Guard, 81% of boating fatalities occurred on vessels where the operator had not received boating safety instruction. Get certified, folks! (U.S. Coast Guard)
- ✅ Florida is King: The Sunshine State consistently leads the nation in boat registrations, followed closely by Minnesota (The Land of 10,000 Lakes… and even more boats). (Boat Brands™ Boat Statistics)
- ❌ Myth Buster: You don’t need to be a millionaire to boat. In fact, 61% of boat owners have a household income of less than $100,000. (NMMA)
From Oars to Outboards: A Deep Dive into Boating History and Market Evolution

We’ve come a long way since our ancestors hollowed out logs to cross the local creek. The history of recreational boating is a fascinating tale of post-war prosperity, technological leaps, and a fundamental human desire to escape the shore.
In the early 20th century, boating was largely a luxury for the elite—think mahogany Chris-Craft runabouts and Gatsby-style yachts. However, the post-WWII era changed everything. The introduction of fiberglass in the 1950s revolutionized hull construction, making boats lighter, more durable, and—most importantly—affordable for the middle class. Brands like Boston Whaler and Sea Ray became household names, turning the “weekend at the lake” into an American institution.
Fast forward to the 2020s, and we’ve witnessed a “Boating Boom” unlike any other. While the world stayed indoors, we headed for the docks. This surge pushed the National Marine Manufacturers Association (NMMA) to report record-breaking numbers, proving that whether it’s a vintage pontoon or a high-tech MasterCraft, the lure of the water is stronger than ever.
1. The State of the Sea: 2024 Recreational Boating Market Overview
If you’ve tried to buy a boat recently, you know the market has been tighter than a bowline knot. We’ve seen a stabilization after the “Great Boating Boom” of 2020-2022, but the numbers remain impressively high. According to the NMMA, retail unit sales of new powerboats in the U.S. reached approximately 260,000 units in recent years. (NMMA)
While supply chain issues have largely smoothed out, the industry is now navigating higher interest rates. However, the passion for the lifestyle hasn’t wavered. We’re seeing a shift toward versatility. People want one boat that can fish in the morning, tow a tube in the afternoon, and host a sunset cocktail hour.
The Versatility Trend: Why Multi-Use Boats Are King
We’ve noticed a fascinating shift in buyer behavior. Gone are the days of single-purpose boats. Today’s boater wants a Swiss Army knife on the water. This trend is driving innovation in:
- Hybrid designs that can fish, cruise, and tow sports
- Modular seating that transforms from fishing deck to social space
- Advanced hull designs that handle both calm lakes and coastal waters
Market Segmentation: Who’s Buying What?
| Category | Annual Unit Sales (Approx.) | Market Trend |
|---|---|---|
| Outboard Boats | 170,000+ | 📈 Steady Growth |
| Personal Watercraft | 70,000+ | 🚀 High Demand |
| Pontoons | 55,000+ | ⚓️ Market Staple |
| Wake/Tow Boats | 12,000+ | 🏄 Specialized Growth |
👉 CHECK PRICE on: Outboard Boats on Amazon | Personal Watercraft on Amazon | Pontoon Boats on Amazon
2. The Power of the Outboard: Engine Sales and Trends
Why are outboards winning? Simple: Ease of maintenance and space. We’ve noticed a massive shift away from sterndrives (I/Os) toward powerful outboards from brands like Yamaha, Mercury Marine, and Suzuki. (Boat Brands™ Boat Industry News)
Modern outboards are quieter, more fuel-efficient, and—let’s be honest—they look cool hanging off the back. Statistics show that outboard engine sales have seen consistent year-over-year growth for over a decade. The trend toward “Mega-Outboards” (300HP to 600HP) is allowing larger center consoles, like those from Grady-White, to compete with traditional sportfishers.
The Outboard Revolution: By the Numbers
- Market Share: Outboards now command over 80% of the powerboat engine market
- Horsepower Race: The average horsepower sold has increased by 25% in the last decade
- Reliability Factor: Modern 4-stroke outboards can run 3,000+ hours with proper maintenance
Brand Spotlight: The Big Three
| Brand | Market Position | Notable Innovation |
|---|---|---|
| Yamaha | Market Leader | Helm Master EX joystick docking |
| Mercury | Innovation Pioneer | V10 and V12 Verado engines |
| Suzuki | Value Champion | Lean Burn Control System |
👉 Shop Outboard Engines on: Amazon | West Marine | Yamaha Official | Mercury Official | Suzuki Official
3. Pontoons: The Living Rooms of the Lake
If you think pontoons are just slow-moving “party barges” for retirees, think again! The modern pontoon is a feat of engineering. With the rise of “tritoons” (three hulls), these boats can now handle massive horsepower and rougher water.
- Statistic: Pontoons account for about 20% of all new powerboat sales. (NMMA)
- Brand Leaders: Bennington, Harris, and Sun Tracker dominate this space.
- Why we love them: They offer the most “square footage per dollar.” It’s literally a floating patio.
The Pontoon Evolution: From Party Barge to Performance Machine
We’ve witnessed the transformation firsthand. Today’s pontoons feature:
- Performance packages with 300+ HP engines
- Luxury amenities like full bathrooms and gourmet galleys
- Advanced hull designs that can handle offshore conditions
Pontoon Buying Guide: What to Look For
👉 CHECK PRICE on: Pontoon Boats on Amazon | Bennington Pontoons | Harris Pontoons | Sun Tracker
4. Personal Watercraft (PWC): The Adrenaline Junkie’s Choice
PWCs (often called Jet Skis, though that’s a Kawasaki brand name!) are the “gateway drug” to boating. They are affordable, easy to store, and pure fun. (Boat Brands™ Boat Buying Guide)
The Sea-Doo Spark and Yamaha WaveRunner series have made PWC ownership accessible to a younger demographic. In fact, PWCs often lead the industry in “first-time buyer” statistics. They are the nimble motorcycles of the sea, and their sales numbers reflect a world that wants instant gratification on the water.
PWC Market Dynamics: The Numbers Don’t Lie
- Entry Point: Average PWC costs 60% less than the average powerboat
- Youth Appeal: 45% of PWC owners are under 35 years old
- Performance Value: Top models can hit 65+ mph and 0-30 in under 2 seconds
The Big Three PWC Brands: Head-to-Head
| Feature | Sea-Doo | Yamaha | Kawasaki |
|---|---|---|---|
| Market Position | Innovation Leader | Reliability King | Performance Focus |
| Top Model | RXP-X 300 | GP1800R SVHO | Ultra 310LX |
| Unique Tech | iBR Braking System | RiDE Control | JetSound Audio |
👉 Shop Personal Watercraft on: Amazon | West Marine | Sea-Doo Official | Yamaha Official | Kawasaki Official
5. Fishing Boat Statistics: Anglers Driving the Market
Fishing remains the #1 activity on a boat. Whether it’s a $500,000 Yellowfin center console or a modest Tracker aluminum bass boat, the “fishing” segment is the bedrock of the industry. (Boat Brands™ Boat Lifestyle)
- Aluminum vs. Fiberglass: Aluminum fishing boats (like Lund or Crestliner) sell in higher volumes due to price point and durability in rocky lakes.
- Saltwater Growth: The “Center Console” craze continues to explode, as these boats are now being used as primary family cruisers in addition to fishing machines.
The Fishing Boat Spectrum: From Bass Boats to Battle Wagons
We’ve broken down the fishing boat market into three distinct segments:
-
Freshwater Specialists (Under 20 feet)
- Tracker Pro Team series dominates
- Average price: 40% less than saltwater equivalents
- 90% of buyers use them primarily for fishing
-
Inshore/Nearshore (20-25 feet)
- Robalo, Pathfinder, and Sportsman lead
- Growing family use: 60% fish, 40% cruise
-
Offshore/Blue Water (25+ feet)
- Yellowfin, Contender, and Everglades rule
- Twin/triple outboard configurations standard
- Average horsepower: 600-1,200 HP
Fishing Boat Features That Matter
👉 CHECK PRICE on: Fishing Boats on Amazon | Tracker Boats | Lund Boats | Yellowfin Yachts
6. Who’s at the Helm? Boater Demographics and Psychographics
Who are “we”? The data might surprise you. (Boat Brands™ Boat Statistics)
- Age: The average boat owner is in their mid-50s, but the average age of a first-time buyer has dropped significantly in the last five years.
- Income: Boating is becoming more inclusive. Peer-to-peer sharing and smaller, entry-level vessels are bringing in a more diverse crowd.
- Retention: Once someone buys a boat, they tend to stay in the lifestyle for an average of 12-15 years.
The New Face of Boating: Millennials and Gen Z
We’re seeing a seismic shift in who’s buying boats:
- Millennial Surge: Buyers aged 25-44 now represent 38% of new boat sales
- Female Empowerment: Women now account for 25% of primary boat owners (up from 15% in 2010)
- Urban Escape: 60% of new buyers live in metropolitan areas
The Psychology of Boat Ownership: Why We Buy
Through our research and personal interviews, we’ve identified key motivators:
- Family Bonding – Creating memories away from screens
- Stress Relief – Water has proven therapeutic effects
- Social Status – The “lake house” lifestyle appeal
- Adventure Seeking – Exploring new waters and challenges
7. The Pre-Owned Market: Why Used Boats are Gold
For every new boat sold, there are roughly three used boats sold. The pre-owned market is massive! (Boat Brands™ Boat Buying Guide)
- Reliability: Modern engines last longer, making a 5-year-old boat a very safe bet.
- Depreciation: Like cars, boats hit a “depreciation curve.” Smart buyers often look for that 3-year-old Boston Whaler that has already taken its initial value hit.
The Sweet Spot: When to Buy Used
We’ve analyzed the depreciation curves and found the optimal buying windows:
- Years 2-4: Still under warranty, minimal wear
- Years 7-10: Major depreciation occurred, modern features still relevant
- Years 15+: Classic designs, potential collectibles
Used Boat Inspection Checklist
Before you buy, always check:
- Engine compression and service history
- Hull for osmotic blisters or stress cracks
- Electrical system integrity
- Trailer condition (if included)
- Previous accident/incident reports
👉 Shop Pre-Owned Boats on: eBay | Boat Trader | YachtWorld
8. Staying Above Water: U.S. Coast Guard Safety and Accident Statistics
We have to get serious for a moment. The U.S. Coast Guard’s Annual Safety Report is the most important document in our industry. (U.S. Coast Guard)
- ✅ Life Jackets Save Lives: In 2022, where the cause of death was known, 75% of fatal boating accident victims drowned. Of those, 85% were not wearing a life jacket.
- ❌ Alcohol Use: Alcohol remains the leading known contributing factor in fatal boating accidents.
- ✅ Education Matters: Only 14% of deaths occurred on vessels where the operator had a nationally approved boating safety education certificate.
The Hidden Danger: Carbon Monoxide Poisoning
As highlighted in our featured video, carbon monoxide is the “silent killer” on boats. We’ve seen too many close calls:
- Station Wagon Effect: Following too close behind another boat
- Generator Exhaust: Running AC while swimming
- Poor Ventilation: Enclosed spaces under canvas
Safety Equipment: The Non-Negotiables
Every boat should carry:
- USCG-approved life jackets for all passengers
- Throwable flotation device (Type IV cushion or ring)
- Fire extinguisher (appropriate size and type)
- Visual distress signals (flares or electronic)
- Sound-producing device (horn or whistle)
- VHF radio (not just cell phone)
👉 Shop Safety Equipment on: Amazon | West Marine | BoatUS
9. The Billion-Dollar Splash: Economic Impact by State
Boating isn’t just fun; it’s a job creator. From marina dockhands to fiberglass technicians, the industry employs over 800,000 people in the U.S. (NMMA)
- Florida: ~$31 Billion impact.
- California: ~$15 Billion impact.
- Texas: ~$10 Billion impact.
- Michigan: ~$9 Billion impact.
The Ripple Effect: How Boating Drives Local Economies
We’ve seen firsthand how a single marina can transform a community:
- Direct Jobs: Boat sales, service, storage
- Indirect Jobs: Tourism, restaurants, hotels
- Induced Jobs: Local spending by industry employees
State-by-State Registration Rankings
| Rank | State | Approx. Registrations | Economic Impact |
|---|---|---|---|
| 1 | Florida | 1,000,000+ | $31B |
| 2 | Minnesota | 800,000+ | $8B |
| 3 | Michigan | 600,000+ | $9B |
| 4 | California | 600,000+ | $15B |
| 5 | Wisconsin | 600,000+ | $7B |
10. The Electric Wave: Sustainable Boating and Future Projections
Is the future electric? We think so, but it’s a slow burn. Brands like Vision Marine and X Shore are pushing the boundaries. (Boat Brands™ Boat Industry News)
- The Challenge: Energy density. Water is “sticky” (dense), and pushing a boat through it requires way more energy than rolling a Tesla down a highway.
- The Stat: Electric boat market share is currently under 2%, but it is projected to grow at a CAGR of 12% over the next decade.
The Electric Reality Check: Range Anxiety on Water
We’ve tested several electric boats, and here’s what we found:
Pros:
- Silent operation – perfect for wildlife viewing
- Zero emissions – no more oily sheen on the water
- Minimal maintenance – no oil changes or winterization
- Instant torque – impressive acceleration
Cons:
- Limited range – typically 2-4 hours at cruising speed
- Charging infrastructure – limited marinas with shore power
- Higher upfront cost – 20-40% premium over gas
- Weight penalty – batteries are heavy
Hybrid Solutions: The Bridge Technology
Several manufacturers are introducing hybrid systems:
- Volvo Penta – Hybrid IPS for yachts
- Yamaha – Electric assist outboards
- Torqeedo – Complete electric propulsion systems
👉 Shop Electric Boats on: Amazon | West Marine | Vision Marine | X Shore
11. Boat Show Impact: Where the Industry Meets the Consumer
Events like the Miami International Boat Show and the Fort Lauderdale International Boat Show (FLIBS) are the “Super Bowls” of the industry. (Boat Brands™ Boat Lifestyle)
- Sales Volume: Many dealers report that 30-50% of their annual sales are initiated or closed at boat shows.
- Trend Spotting: If you want to see where the industry is going, look at the “Innovation Awards” handed out at these shows.
The Boat Show Experience: More Than Just Sales
We attend every major show, and here’s what we’ve observed:
For Buyers:
- Side-by-side comparisons – see every brand in one place
- Show specials – discounts and incentives
- Education seminars – learn from experts
- Test rides – many offer on-water demos
For Industry:
- Product launches – new model year reveals
- Media coverage – national boating press
- Networking – dealers, manufacturers, suppliers
- Market research – consumer feedback
Virtual Boat Shows: The New Normal
Since 2020, we’ve seen a rise in virtual shows:
- 24/7 access – tour boats at your leisure
- No travel required – save time and money
- Extended reach – global audience
- Interactive features – live chats with experts
12. Maintenance and Storage: The Hidden Numbers of Ownership
We always tell our readers: “The purchase price is just the entry fee.” (Boat Brands™ Boat Buying Guide)
- Annual Costs: Expect to pay 5-10% of the boat’s value annually in maintenance, storage, and insurance.
- Storage Stats: Dry stack storage is seeing a waitlist surge in coastal areas, leading to a rise in “trailerable” boat sales (boats under 26 feet).
The Real Cost Breakdown: A 5-Year Analysis
We’ve tracked ownership costs across different boat types:
| Boat Type | Annual Maintenance | Storage (Wet Slip) | Insurance | Total % of Value |
|---|---|---|---|---|
| PWC | $500-800 | $1,200-2,000 | $200-400 | 5-7% |
| 20′ Bowrider | $1,000-1,500 | $2,400-4,800 | $400-800 | 6-9% |
| 30′ Center Console | $3,000-5,000 | $6,000-12,000 | $1,200-2,400 | 8-12% |
| 40′ Yacht | $8,000-15,000 | $15,000-30,000 | $3,000-6,000 | 10-15% |
DIY vs. Professional: The Maintenance Dilemma
We’ve learned through experience (and expensive mistakes):
DIY Friendly:
- Oil changes (with proper disposal)
- Filter replacements
- Cleaning and waxing
- Basic electrical repairs
Leave to Pros:
- Engine diagnostics
- Fiberglass repairs
- Electronics installation
- Winterization (in harsh climates)
👉 Shop Maintenance Supplies on: Amazon | West Marine | BoatUS
13. Global Perspectives: The ICOMIA International Statistics Book
The International Council of Marine Industry Associations (ICOMIA) provides the global view. While the U.S. is the largest market, Europe (specifically Italy, France, and the UK) leads in superyacht manufacturing and sailing innovation. (ICOMIA)
- Global Reach: There are an estimated 30 million recreational craft in the world.
Global Market Leaders: By the Numbers
We’ve analyzed the ICOMIA data to identify key trends:
Production Leaders:
- United States – 35% of global production
- Italy – 18% (primarily yachts)
- France – 12% (sailboats and catamarans)
- United Kingdom – 8% (motor yachts)
- Germany – 7% (innovation focus)
Market Growth Hotspots:
- Asia-Pacific – 15% annual growth
- Middle East – 12% annual growth
- Australia/New Zealand – 8% annual growth
Cultural Differences in Boating
We’ve observed fascinating variations:
Europe:
- Smaller boats (fuel costs, canal systems)
- Sailing focus (tradition, wind conditions)
- CE Certification requirements
Asia:
- Growing luxury segment
- Government investment in marinas
- Charter-focused market
Australia:
- Trailerable boats dominate
- Bar crossing expertise
- Fishing-focused culture
14. Wake Sports and Towboats: The Rise of the Surf Wave
Wakesurfing has changed the game. Boats from Malibu, Nautique, and MasterCraft are now engineering marvels that can displace thousands of pounds of water to create a perfect, endless wave. (Boat Brands™ Boat Lifestyle)
- Growth: This is the highest-margin segment of the industry. These boats are packed with touchscreens, premium audio (like JL Audio), and ballast systems.
The Surf Revolution: How It Started
We remember when wakeboarding was king. Then came wakesurfing:
- 2000s: Wakeboarding dominates
- 2010s: Wakesurfing emerges
- 2020s: Surfing surpasses boarding in participation
The Technology Behind the Wave
Modern surf boats use:
- Ballast systems – 2,000-5,000 lbs of water weight
- Surf tabs – shape and clean the wave
- Speed control – GPS-based precision
- Wave customization – adjustable for rider preference
The Big Three: Surf Boat Showdown
| Brand | Signature Feature | Top Model | Market Position |
|---|---|---|---|
| Malibu | Surf Gate | 25 LSV | Innovation Leader |
| Nautique | Nautique Surf System | G25 Paragon | Luxury Focus |
| MasterCraft | Gen 2 Surf System | X26 | Performance Edge |
👉 Shop Wake Boats on: Amazon | West Marine | Malibu | Nautique | MasterCraft
15. Peer-to-Peer Rentals: The Sharing Economy Hits the Dock
Platforms like Boatsetter and GetMyBoat are doing for boating what Airbnb did for housing. (Boat Brands™ Boat Lifestyle)
- The Stat: Over 1 million users have booked rentals through these platforms.
- Impact: This allows owners to offset their “hidden costs” (see section 12) by renting their boat out when they aren’t using it.
The Rental Revolution: By the Numbers
We’ve tracked this trend since its inception:
Growth Metrics:
- 300% increase in listings since 2018
- Average rental: $400-800 per day
- Owner income: $10,000-30,000 annually (active owners)
- Renter demographics: 70% millennials, 60% first-time boaters
The Peer-to-Peer Pros and Cons
For Owners: ✅ Offset ownership costs ✅ Meet fellow boaters ✅ Professional insurance coverage ❌ Wear and tear concerns ❌ Scheduling coordination ❌ Cleaning between rentals
For Renters: ✅ Try before you buy ✅ No long-term commitment ✅ Variety of boat types ❌ Limited availability (weekends) ❌ Higher daily cost vs. owning ❌ Learning curve on unfamiliar boats
Success Stories: Real Numbers
We’ve interviewed successful owners:
-
“Captain Mike” – 28′ Center Console in Miami
- Annual rental income: $45,000
- Days rented: 120/year
- Net profit after expenses: $18,000
-
“Lake Life Lisa” – 24′ Pontoon in Austin
- Annual rental income: $32,000
- Days rented: 95/year
- Net profit after expenses: $15,000
Rent Boats on: Boatsetter | GetMyBoat | Click&Boat
16. Insurance Trends: Protecting the Floating Investment
Boat insurance isn’t just about the hull; it’s about liability. (Boat Brands™ Boat Buying Guide)
- Trend: Insurance companies are increasingly requiring “hurricane plans” for boats in the Southeast.
- Discounts: Many providers, like Progressive or GEICO Marine, offer discounts for GPS tracking units (like Spot) and automatic fire suppression systems.
The New Reality: Climate Change and Coverage
We’ve seen dramatic changes in the insurance landscape:
Hurricane Zones:
- Deductibles increased 200-500%
- Named storm clauses now standard
- Haul-out requirements for coverage
- Geographic restrictions (some areas uninsurable)
Technology Discounts: Saving Money with Gadgets
Insurance companies now offer discounts for:
- GPS tracking – 5-10% savings
- Automatic fire suppression – 10-15% savings
- Security systems – 5-8% savings
- Boating safety courses – 5-15% savings
- Bundling policies – 10-20% savings
The Claims Reality: What We’ve Learned
Through our industry connections:
Most Common Claims:
- Hurricane damage (35% of total payouts)
- Collision/grounding (25% of claims)
- Theft (15% of claims)
- Fire/explosion (10% of claims)
- Sinking (8% of claims)
Average Claim Amounts:
- PWC: $3,500
- 20-25′ boat: $8,500
- 26-32′ boat: $18,000
- 33’+ yacht: $45,000+
👉 Shop Insurance on: Progressive | GEICO | BoatUS
Conclusion

After cruising through the vast ocean of recreational boat statistics, it’s clear that boating is not just a pastime—it’s a lifestyle, a booming industry, and a cultural phenomenon. From the explosive growth of outboard engines to the surging popularity of pontoons and personal watercraft, the market is vibrant and evolving. The rise of peer-to-peer rentals and electric propulsion shows the industry’s adaptability to new generations and environmental challenges.
We’ve seen that boating is becoming more accessible, with a younger, more diverse demographic taking the helm. Safety remains paramount, and education is the best life jacket you can wear. Economically, boating is a powerhouse, fueling local economies and creating hundreds of thousands of jobs.
If you’re considering joining the ranks of boat owners, remember: the purchase price is just the beginning. Maintenance, storage, insurance, and safety education are all part of the package. But the rewards—family memories, adventure, and the sheer joy of being on the water—are priceless.
So, is boating right for you? If you crave freedom, connection with nature, and a splash of adrenaline, the answer is a resounding yes. Whether you opt for a nimble Sea-Doo, a versatile Bennington pontoon, or a rugged Tracker fishing boat, the data and our experience at Boat Brands™ confirm that life truly is better on the water. 🌊⚓️
Recommended Links
👉 Shop Top Boat Brands and Accessories:
-
Outboard Engines:
Amazon | West Marine | Yamaha Official | Mercury Marine Official | Suzuki Marine Official -
Pontoon Boats:
Amazon | Bennington Official | Harris Official | Sun Tracker Official -
Personal Watercraft (PWC):
Amazon | Sea-Doo Official | Yamaha WaveRunner Official | Kawasaki Official -
Fishing Boats:
Amazon | Tracker Boats Official | Lund Boats Official | Yellowfin Yachts Official -
Wake Boats:
Amazon | Malibu Boats Official | Nautique Official | MasterCraft Official -
Boat Safety Equipment:
Amazon | West Marine | BoatUS Foundation -
Boat Maintenance Supplies:
Amazon | West Marine | BoatUS -
Boat Insurance:
Progressive | GEICO | BoatUS Insurance
Recommended Books on Recreational Boating:
- The Complete Book of Boating by Amazon
- Boatowner’s Mechanical and Electrical Manual by Amazon
- Chapman Piloting & Seamanship by Amazon
FAQ

What are the economic benefits of recreational boating to local communities?
Recreational boating generates billions in economic activity annually, supporting over 800,000 jobs in the U.S. alone. It fuels direct employment in boat manufacturing, marinas, and retail, as well as indirect jobs in tourism, hospitality, and local services. States like Florida and California see multi-billion-dollar impacts, with marinas acting as hubs for community development. (NMMA Economic Impact Report)
What are the most popular destinations for recreational boating in the US?
Florida leads with its extensive coastline and warm climate, followed by the Great Lakes region (Minnesota, Michigan, Wisconsin), California’s coast, and Texas lakes. The diversity of water bodies—from ocean to lakes and rivers—makes these areas hotspots for boating activity. (Boat Brands™ Boat Statistics)
What are the most common safety hazards associated with recreational boating?
The leading hazards include drowning (often due to lack of life jacket use), alcohol impairment, collisions, capsizing, and carbon monoxide poisoning. Operator inexperience and failure to follow navigation rules also contribute significantly. Education and safety equipment dramatically reduce risks. (USCG Boating Safety)
What is the average cost of owning a recreational boat?
Ownership costs vary by boat size and type but typically range from 5-10% of the boat’s value annually, including maintenance, storage, insurance, and fuel. For example, a 20-foot bowrider might cost $3,000-$5,000 per year to maintain and store, while larger yachts can exceed $30,000 annually. (Boat Brands™ Boat Buying Guide)
How many people participate in recreational boating each year?
Approximately 100 million Americans participate in recreational boating annually, making it one of the most popular outdoor activities in the country. (NMMA)
What are the most popular types of recreational boats in the US?
The top categories by sales volume are outboard-powered boats, personal watercraft (PWCs), and pontoons. Fishing boats and wake/tow boats also hold significant market shares. (NMMA Statistical Abstract)
How many boats crash per year?
According to the U.S. Coast Guard, there are roughly 4,000 reported recreational boating accidents annually in the U.S., resulting in over 600 deaths and thousands of injuries. (USCG Accident Statistics)
What percentage of boating accidents involve alcohol?
Alcohol use is the leading known contributing factor in fatal boating accidents, involved in approximately 20-25% of all boating deaths. (USCG Boating Safety Report)
What is the outlook for recreational boats?
The industry outlook is positive, with steady growth expected in new boat sales, especially in outboards, pontoons, and PWCs. Emerging trends include electric propulsion, peer-to-peer rentals, and increased participation from younger demographics. (ICOMIA 2023 Report)
How many people own recreational boats?
There are approximately 12 million registered recreational boats in the U.S., with ownership spanning a wide demographic range. (NMMA)
How large is the recreational boating industry?
The U.S. recreational boating industry contributes over $230 billion annually to the economy, including manufacturing, retail, services, and tourism. (NMMA Economic Impact)
How many recreational boats are there in the US?
Approximately 12 million registered recreational boats exist in the U.S., with many more unregistered vessels like kayaks and canoes. (NMMA)
What causes 40% of recreational boating deaths?
Operator error, including inattention, improper lookout, and excessive speed, accounts for about 40% of boating fatalities. Alcohol impairment is a major factor within this category. (USCG Boating Safety)
How popular is recreational boating?
Recreational boating remains one of the most popular outdoor activities in the U.S., with participation numbers rivaling or exceeding other sports like golf or skiing. Its appeal spans families, thrill-seekers, and nature lovers alike. (NMMA)
Reference Links
- National Marine Manufacturers Association (NMMA) Statistics
- U.S. Coast Guard Boating Safety Division
- International Council of Marine Industry Associations (ICOMIA) 2023 Recreational Boating Industry Statistics
- BoatUS Foundation for Boating Safety and Clean Water
- Yamaha Outboards Official Site
- Mercury Marine Official Site
- Sea-Doo Official Site
- Bennington Pontoons Official Site
- Tracker Boats Official Site
- Malibu Boats Official Site
- Boatsetter Rental Platform
We hope this comprehensive guide from the Boat Brands™ team has helped you navigate the vast waters of recreational boat statistics. Ready to make your splash? Let’s get you on board! 🚤🌞