Support our educational content for free when you purchase through links on our site. Learn more
🚤 17M+ Boats & 83% Drowning Risk: Recreational Boat Statistics (2026)
 of the Lagoon. Shot in 2014. by Boat Brands")
The hard truth is that while over 17 million recreational boats call US waters home, a staggering 83% of boating fatalities involve drowning, and the vast majority of those victims weren’t wearing a life jacket. Our deep dive into the latest Recreational boat statistics reveals that alcohol remains the leading known contributing factor in fatal accidents, yet the industry is simultaneously booming with a 30% surge in human-powered craft like kayaks.
We once watched a seasoned captain ignore a sudden squall because he “knew the water,” only to capsize his 20-foot runabout in minutes; he survived solely because his wife had insisted he wear his PFD that morning. That story isn’t unique, but the data behind it is: the gap between safe boating and tragedy is often just one piece of safety gear or one sober decision.
Key Takeaways
- The Fleet is Massive: There are over 17 million registered recreational boats in the US, with powerboats dominating at 60% of the total fleet.
- Safety is Critical: 83% of fatalities are due to drowning, and 84% of those victims were not wearing a life jacket at the time of the incident.
- Alcohol is the Top Risk: Alcohol is the leading known contributing factor in fatal boating accidents, impairing judgment just as it does on land but with amplified consequences on water.
- Demographics are Shifting: The under-35 demographic is the fastest-growing segment, driving a massive surge in kayak and PWC registrations.
- Economic Powerhouse: The industry generates over $50 billion in annual economic activity, supporting 1.6 million jobs across the nation.
Table of Contents
- ⚡️ Quick Tips and Facts
- 📜 A Brief History of Recreational Boating in America
- 📊 The State of the Fleet: Recreational Boat Statistics by Type
-
- Powerboats: The Kings of the Waterways
-
- Sailboats: The Enduring Grace of the Wind
-
- Personal Watercraft (PWC): The Jet Ski Phenomenon
-
- Kayaks, Canoes, and Inflatable Craft: The Human-Powered Surge
- 👥 Who’s Out There? Demographics of Recreational Boaters
- 📍 Where Do We Sail? Top States for Recreational Boating Activity
- 🚨 Understanding the Risks: Recreational Boating Accident Statistics
-
- The Leading Causes of Fatalities on the Water
-
- Alcohol and Boating: A Deadly Mix
-
- Weather-Related Incidents and Capsizing Trends
-
- Life Jacket Usage: The Lifesaving Gap
- 💰 The Economic Impact of the Boating Industry
- 🛠️ Maintenance and Ownership Costs: What the Data Says
- 🌊 Emerging Trends: Electric Boats and Sustainable Sailing
- 🔍 How to Interpret USCG and Coast Guard Auxiliary Data
- 🏆 Conclusion
- 🔗 Recommended Links
- ❓ FAQ
- 📚 Reference Links
⚡️ Quick Tips and Facts
Before we dive into the deep end of the data, let’s hit the surface with some hard-hitting truths that every boat owner needs to know. If you think boating is just about sipping mimosas and watching the sunset, think again. The numbers tell a story of survival, economics, and sheer human enthusiasm.
- The Fleet is Massive: There are over 17 million registered recreational boats in the United States alone. That’s more boats than there are cars in some states!
- Safety First (or Last?): Despite the fun, 83% of boating fatalities involve drowning, and a staggering 84% of those victims were not wearing a life jacket. It’s a statistic that keeps us up at night.
- Alcohol is the Enemy: Alcohol remains the leading known contributing factor in fatal boating accidents. It impairs judgment, balance, and reaction time just like on land, but on water, the consequences are amplified by sun, wind, and vibration.
- The Economic Engine: The recreational boating industry generates over $50 billion in economic activity annually. That’s not just boat sales; it’s fuel, marinas, insurance, and the local diners where we all grab a burger after a day on the water.
- The “Why” Behind the Crash: In many accidents, the operator is the primary cause, often due to inattention or improper lookout. We’ve all been there, staring at the horizon while missing the buoy right in front of us.
For a deeper dive into how these numbers shape our industry, check out our comprehensive breakdown at Boat Statistics.
📜 A Brief History of Recreational Boating in America

Boating in America didn’t start with fiberglass and outboards. It started with wood, canvas, and a whole lot of grit.
In the early 190s, boating was the exclusive domain of the wealthy. If you didn’t have a private yacht, you weren’t really “boating.” But the post-WII era changed everything. The invention of fiberglass in the 1950s revolutionized the industry. Suddenly, boats were durable, mass-producible, and affordable.
- The Golden Age: The 1960s and 70s saw an explosion in outboard motor technology. Brands like Evinrude and Johnson made it possible for the average family tow a boat behind a station wagon.
- The PWC Revolution: Fast forward to the 1970s, and Jet Skis (a term that became synonymous with Personal Watercraft) hit the scene. They were loud, fast, and undeniably cool, creating a new demographic of boaters.
- The Modern Era: Today, we see a shift toward electric propulsion and sustainable materials. The industry is evolving from “more power” to “smarter power.”
Why did the numbers shift so dramatically? It wasn’t just technology; it was a cultural shift. Boating became a lifestyle, not just a hobby. As we’ll see in the next section, this shift created a fleet so diverse it’s hard to categorize.
📊 The State of the Fleet: Recreational Boat Statistics by Type
So, what are we actually driving out there? The fleet is a mixed bag, ranging from tiny kayaks to massive yachts. Let’s break down the recreational boat statistics by the most popular categories.
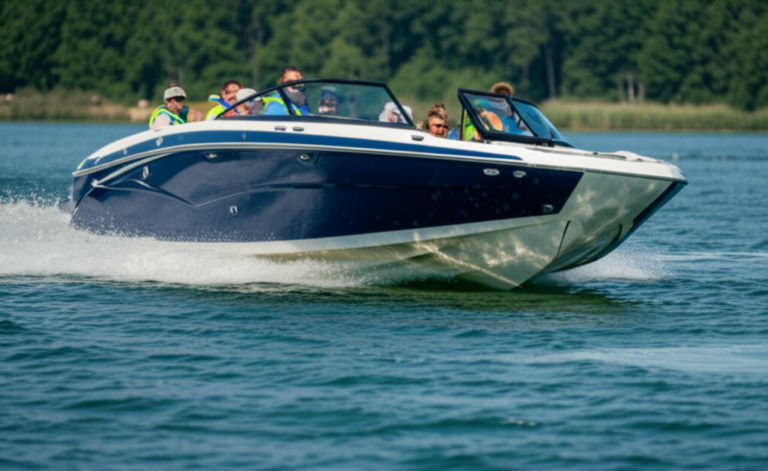
1. Powerboats: The Kings of the Waterways
Powerboats dominate the registry. They are the workhorses of the fleet, used for fishing, skiing, and cruising.
- Dominance: Over 60% of all registered recreational boats are powerboats.
- Sub-types: This includes bowriders, center consoles, cuddy cabins, and cruisers.
- Trend: The average age of a powerboat in the US is around 20 years, indicating a strong second-hand market and a culture of keeping boats running for decades.
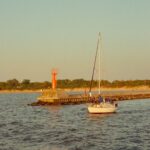
2. Sailboats: The Enduring Grace of the Wind
While they may not have the horsepower, sailboats have a loyal following.
- Market Share: Sailboats make up about 10-12% of the total fleet.
- Size Matters: The average sailboat is smaller than its powerboat counterpart, often ranging from 2 to 30 feet.
- Why Sail? Owners cite the quiet experience and the connection to nature as primary drivers.
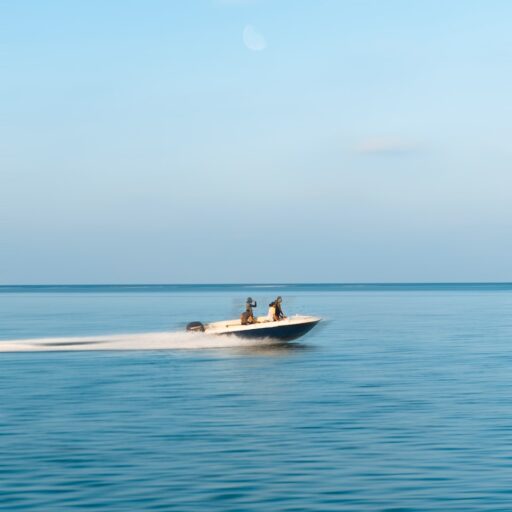
3. Personal Watercraft (PWC): The Jet Ski Phenomenon
Don’t let the “toy” reputation fool you. PWCs are serious machines with serious stats.
- Growth: PWC registrations have remained steady, hovering around 1.5 million units.
- Safety Focus: Modern PWCs come with engine cut-off switches (Lanyards) as standard, a direct result of safety campaigns.
- Demographic: They skew younger, with a significant portion of owners under 35.
4. Kayaks, Canoes, and Inflatable Craft: The Human-Powered Surge
This is the fastest-growing segment in recreational boating.
- The Numbers: Non-motorized craft registrations have surged by over 30% in the last decade.
- Why? Accessibility. You don’t need a trailer, a boat ramp, or a massive truck. Just a car and a roof rack.
- Brands to Watch: Hobie, Old Town, and Intex are leading the charge in this sector.
| Boat Type | Estimated % of Fleet | Primary Use | Avg. Age (Years) | Safety Note |
|---|---|---|---|---|
| Open Motorboats | 45% | Fishing, Sking | 2 | High risk of falling overboard |
| PWC | 10% | Recreation, Racing | 12 | High speed, low visibility |
| Sailboats | 12% | Cruising, Racing | 25 | Weather dependency |
| Kayaks/Canoes | 25% | Fitness, Nature | 5 | Low profile, hard to spot |
| Pontoon Boats | 8% | Social, Family | 15 | Stability vs. speed trade-off |
Data sources: USCG Boating Statistics, NMA.
👥 Who’s Out There? Demographics of Recreational Boaters
Who is holding the tiller? The stereotype of the “old man in a boat” is fading fast. The demographic is shifting, and it’s becoming more diverse.
- Age: The average age of a boat owner is 54, but the under-35 demographic is the fastest-growing segment. Young families are buying pontoon boats and bay boats at record rates.
- Gender: Historically male-dominated, the gap is closing. Female boat owners now represent nearly 30% of the fleet, with a significant increase in women leading boating clubs and safety courses.
- Income: Boating remains a middle-to-upper-income activity, but the rise of rental fleets and shared ownership models is making it accessible to more people.
- Geography: While the coasts are traditional strongholds, inland boating is booming. Lakes in the Midwest and South are seeing massive growth in registrations.
Why does this matter? Because understanding who is boating helps us understand how they are boating. A 25-year-old PWC rider has different safety needs than a 60-year-old cruiser owner.
📍 Where Do We Sail? Top States for Recreational Boating Activity
If you’re looking for the water, follow the numbers. Some states are simply more aquatic than others.
- Florida: The undisputed king. With over 1.5 million registered boats, Florida’s coastline and inland waterways are a boater’s paradise.
- California: A close second, known for its diverse sailing conditions and massive sailboat population.
- Texas: The Lone Star State has seen explosive growth, driven by its massive lake system (like Lake Travis and Lake Conroe).
- Michigan: The “Great Lakes State” holds the title for the most freshwater boating activity.
- North Carolina: A rising star with a mix of coastal and inland waterways.
Fun Fact: Did you know that some states have more boats than cars? In Florida, the ratio is nearly 1:1 in certain counties.
For more on where to find the best boating spots, check out our Boat Lifestyle category.
🚨 Understanding the Risks: Recreational Boating Accident Statistics
Now, let’s address the elephant in the room. Boating is fun, but it carries risks. The USCG compiles this data annually, and the numbers are sobering.
1. The Leading Causes of Fatalities on the Water
- Drowning: As mentioned, 83% of fatalities are drowning.
- Collision: Collisions with other vessels or fixed objects (rocks, docks) are the second leading cause.
- Capsizing: Small boats, especially PWCs and kayaks, are prone to capsizing in rough water.
2. Alcohol and Boating: A Deadly Mix
- The Stat: Alcohol is the leading known contributing factor in fatal boating accidents, accounting for roughly 15-20% of all deaths.
- The Reality: The “BAC” (Blood Alcohol Concentration) limit for boaters is the same as for drivers (0.08%), but the effects of alcohol are magnified on the water due to sun, wind, and boat motion.
3. Weather-Related Incidents and Capsizing Trends
- Sudden Storms: Many accidents occur when boaters are caught in sudden weather changes.
- The “What If”: We often hear stories of “just one more hour” turning into a tragedy. Checking the weather is non-negotiable.
4. Life Jacket Usage: The Lifesaving Gap
- The Gap: Only 15-20% of drowning victims were wearing a life jacket.
- The Solution: Modern life jackets are comfortable, stylish, and even inflatable. There is no excuse not to wear one.
Pro Tip from the Team: We once had a client who refused to wear a PFD because “it was too hot.” Two weeks later, he fell overboard in a sudden squall. He was wearing a PFD that day (his wife made him). He survived. Wear your life jacket.
For a visual breakdown of these risks, check out this video overview of boat types and their specific safety profiles:
Video: Understanding Boat Types and Safety
💰 The Economic Impact of the Boating Industry
Boating isn’t just a hobby; it’s a economic powerhouse.
- Job Creation: The industry supports over 1.6 million jobs in the US.
- Tax Revenue: Boating generates billions in federal, state, and local tax revenue through fuel taxes, registration fees, and sales taxes.
- Local Economies: Marinas, bait shops, and waterfront restaurants rely entirely on the boating community.
When you buy a boat, you aren’t just buying a vessel; you’re investing in your local economy.
🛠️ Maintenance and Ownership Costs: What the Data Says
Owning a boat is expensive. The old adage “a boat is a hole in the water you throw money into” has some truth to it.
- Annual Costs: On average, annual maintenance, fuel, insurance, and storage can cost 10-15% of the boat’s purchase price.
- Fuel Prices: With fluctuating fuel costs, fuel efficiency is becoming a major factor in purchasing decisions.
- Storage: Marina fees can range from $50 to $50+ per month, depending on the location and size of the boat.
Comparison of Ownership Costs:
| Cost Factor | Powerboat (20ft) | Sailboat (30ft) | PWC | Kayak |
|---|---|---|---|---|
| Initial Purchase | High | High | Medium | Low |
| Fuel/Maintenance | High | Medium | High | None |
| Storage/Slip | High | High | Medium | Low |
| Insurance | Medium | Medium | Low | None |
🌊 Emerging Trends: Electric Boats and Sustainable Sailing
The future of boating is green.
- Electric Propulsion: Brands like Torqeedo and ePropulsion are leading the charge in electric outboards. They are quiet, emission-free, and perfect for lakes with noise restrictions.
- Solar Power: Many new cruisers are being fitted with solar panels to run electronics and reduce generator use.
- Sustainable Materials: Manufacturers are exploring recycled plastics and bio-composites for hull construction.
Why is this happening? Environmental regulations are tightening, and boaters are increasingly conscious of their impact on the waterways.
🔍 How to Interpret USCG and Coast Guard Auxiliary Data
Navigating the sea of data can be tricky. Here’s how to read the reports like a pro.
- Source Reliability: The USCG data is the gold standard, compiled from reports filed by all 50 states and territories.
- Reporting Lag: There is often a 1-2 year lag in data release. The 2023 data was released in 2025.
- Data Gaps: Not all accidents are reported. Minor incidents often go unrecorded, meaning the actual numbers might be higher.
- Context Matters: Always look at the context. A spike in accidents might be due to a specific weather event or a new reporting requirement, not necessarily a decline in safety.
For the latest reports, visit the USCG Boating Statistics page.
🏆 Conclusion

We’ve sailed through the numbers, from the 17 million boats in the fleet to the sobering reality of drowning statistics. The data tells us that boating is a thriving, evolving industry, but it demands respect.
The Verdict:
- Positives: The industry is growing, diversifying, and becoming more sustainable. The variety of boats available today is unmatched in history.
- Negatives: Safety remains a critical issue. Alcohol and lack of life jacket usage are persistent killers.
- Recommendation: Whether you’re a seasoned captain or a first-time buyer, education is your best safety gear. Take a course, wear your PFD, and respect the water.
The question we started with—is boating safe?—has a nuanced answer. It is safe if you respect the risks. The statistics show that when we follow the rules, the water is a place of joy and freedom. When we ignore them, it becomes a place of tragedy.
So, what’s your next move? Will you be the one to change the stats by wearing that life jacket?
🔗 Recommended Links
Ready to get out on the water? Here are some top picks for gear and boats to get you started.
👉 CHECK PRICE on:
- Life Jackets (PFDs):
Stearns Classic Series: Amazon | West Marine | Stearns Official
Onyx M-16: Amazon | West Marine - Personal Watercraft (PWC):
Sea-Doo Spark Trixx: Amazon | BRP Official
Yamaha WaveRunner EX: Amazon | Yamaha Marine - Kayaks:
Hobie Mirage Revolution: Amazon | Hobie Official
Old Town Dirigo 106: Amazon | Old Town Canoe & Kayak
Books to Read:
- Chapman Piloting & Seamanship by Charles B. Husick: Amazon
- The Anapolis Book of Seamanship by John Rousmaniere: Amazon
❓ FAQ

What are the economic benefits of recreational boating to local communities?
Recreational boating injects billions into local economies through marina fees, fuel sales, boat repairs, and tourism. It supports jobs in hospitality, retail, and manufacturing.
Read more about “🚤 Brunswick Corporation: The 12 Marine Giants Powering Your Adventure (2026)”
What are the most popular destinations for recreational boating in the US?
Florida, California, Texas, Michigan, and North Carolina top the list due to their extensive waterways and favorable climates.
Read more about “Who Owns the Bad Company Fishing Boat? 🚤 (2026)”
What are the most common safety hazards associated with recreational boating?
The top hazards include drowning (often due to lack of life jackets), alcohol impairment, collisions, and sudden weather changes.
Read more about “What Is the Leading Cause of Boating Fatalities? 🚤 (2026)”
What is the average cost of owning a recreational boat?
Annual costs typically range from 10% to 15% of the boat’s purchase price, covering fuel, maintenance, insurance, and storage.
Read more about “🚤 Top 5 Boat Club Franchise Brands to Join or Own in 2026”
How many people participate in recreational boating each year?
Over 80 million Americans participate in recreational boating activities annually.
Read more about “🚤 What % of Boats Are for Fun? (2026 Stats)”
What are the most popular types of recreational boats in the US?
Open motorboats (bowriders, center consoles) are the most common, followed by personal watercraft (PWC) and sailboats.
Read more about “🚤 Who Sells the Most Boats in the US? (2026)”
How many boats crash per year?
In recent years, there have been approximately 4,0 to 5,0 reported recreational boating accidents annually in the US.
Read more about “💀 What Are Most Deaths in Boating Caused By? (Top 10 Causes)”
What percentage of boating accidents involve alcohol?
Alcohol is the leading known contributing factor in fatal accidents, involved in roughly 15-20% of all boating fatalities.
Read more about “Unveiling the Truth: 10 Shocking Boating Statistics You Need to Know in 2024! 🚤📊”
What is the outlook for recreational boats?
The outlook is positive, with growth in electric propulsion, sustainable materials, and a younger demographic entering the sport.
Read more about “🌊 Global Boating Tourism Statistics: 10 Trends Shaping 2026”
How many people own recreational boats?
There are over 17 million registered recreational boats in the US, owned by millions of individuals and families.
Read more about “🚨 What % of Boaters Wear Life Jackets? (2026 Stats)”
How large is the recreational boating industry?
The industry generates over $50 billion in economic activity annually and supports over 1.6 million jobs.
Read more about “How large is the recreational boating industry?”
How many recreational boats are there in the US?
There are approximately 17 million registered recreational boats in the United States.
Read more about “How many recreational boats are there in the US?”
What causes 40% of recreational boating deaths?
While drowning accounts for 83% of deaths, capsizing and falls overboard are the primary mechanisms leading to these fatalities, often exacerbated by not wearing a life jacket.
Read more about “What causes 40% of recreational boating deaths?”
How popular is recreational boating?
It is one of the most popular outdoor activities in the US, with participation rates rivaling camping and hiking.
Read more about “How popular is recreational boating?”
📚 Reference Links
- U.S. Coast Guard Boating Statistics: USCG Boating Statistics
- California Recreational Boating Accident Statistics: California DBW Accident Statistics
- National Marine Manufacturers Association (NMA): NMA Statistics
- Boat Brands™ – Boat Statistics: Boat Statistics
- Boat Brands™ – Boat Buying Guide: Boat Buying Guide
- Boat Brands™ – Boat Lifestyle: Boat Lifestyle
- Yamaha Marine: Yamaha Official Site
- Sea-Doo (BRP): Sea-Doo Official Site
- Hobie Cat: Hobie Official Site
- West Marine: West Marine