Support our educational content for free when you purchase through links on our site. Learn more
🌊 10 Shocking Coastal Boating Statistics You Must Know (2026)


The single most critical insight from the latest coastal boating statistics is that calm weather and a lack of life jacket usage kill far more boaters than storms ever will. While the ocean’s vastness intimidates us, the data reveals that complacency is the true silent killer on the water.
We’ve all heard the stories of the “perfect day” turning tragic, but the numbers behind these incidents are often more surprising than the anecdotes themselves. Did you know that 83% of drowning victims were not wearing a life jacket, even when the water was glassy and the sun was shining?
These coastal boating statistics aren’t just dry numbers for a government report; they are a roadmap to keeping your crew safe. From the hidden dangers of alcohol impairment to the critical role of operator training, understanding these trends could be the difference between a great day out and a tragedy.
Key Takeaways
- Complacency Kills: The majority of fatal accidents occur in calm weather with good visibility, proving that risk is highest when you feel safest.
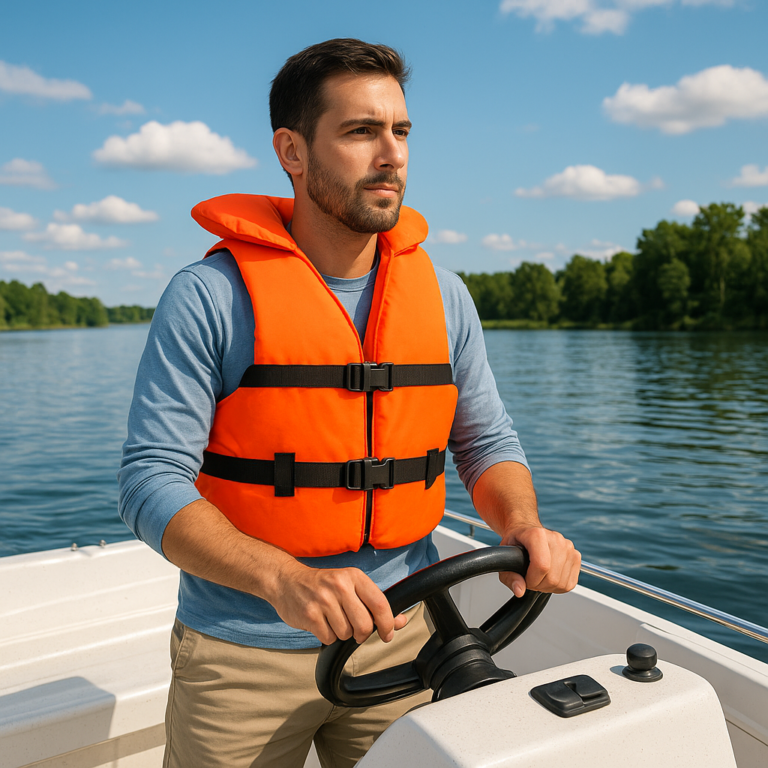
- Life Jackets Are Non-Negotiable: 83% of drowning victims were not wearing a life jacket, highlighting that having one on board is useless if it isn’t worn.
- Training Saves Lives: 75% of fatal accident victims were on boats where the operator had no formal boating safety instruction.
- Alcohol Remains the Top Risk: Alcohol is the leading known contributing factor in fatal boating accidents, accounting for roughly 16% of all fatalities.
- Coastal Waters Demand Respect: While inland waters see more total accidents, coastal environments introduce unique hazards like tides, currents, and commercial traffic that drastically change safety dynamics.
Table of Contents
- ⚡️ Quick Tips and Facts
- 📜 A Brief History of Coastal Boating Data and Why It Matters
- 📊 2024 United States Coast Guard Recreational Boating Statistics: The Full Breakdown
- 1. Total Registered Recreational Boats by State and Class
- 2. Fatal Accident Rates and Trends in Coastal Waters
- 3. The Leading Causes of Marine Collisions and Capsizes
- 4. Alcohol Involvement in Recreational Boating Accidents
- 5. Life Jacket Usage Rates: The Numbers That Save Lives
- 6. Weather-Related Incidents and Seasonal Safety Spikes
- 7. Engine Failure Statistics and Mechanical Reliability Data
- 8. Man Overboard Incidents and Rescue Response Times
- 9. Vessel Traffic Density in High-Traffic Coastal Coridors
- 10. Demographic Shifts: Who Is Actually Boating in 2024?
- 🌊 Coastal vs. Inland: How Boating Safety Stats Compare Across Regions
- 🛥️ The Economic Impact of Recreational Boating on Coastal Communities
- 🚨 Understanding the USCG Accident Report Form: A Guide for Boat Owners
- 🧭 Navigating the Future: Emerging Trends in Marine Safety Technology
- 🏛️ Advocacy in Action: How the MRA Shapes Boating Policy and Safety
- 🌍 International Perspectives: Global Coastal Boating Safety Standards
- 💡 Pro Tips for Safe Coastal Cruising Based on Real Data
- ❓ Frequently Asked Questions About Coastal Boating Statistics
- 🔗 Recommended Links for Further Reading
- 📚 Reference Links and Data Sources
- 🏁 Conclusion
⚡️ Quick Tips and Facts
Before we dive into the deep end of the data, let’s get the life jackets on and the basics straight. If you’re skimming this because you’re in a rush, here is the crystal-clear truth about coastal boating statistics that every skiper needs to know:
- The “Benign Weather” Trap: You’d think storms kill more boaters, right? Wrong. According to the latest US Coast Guard data, the majority of fatal accidents happen in calm waters with good visibility. Complacency is the real killer.
- The Life Jacket Math: It’s not just about having a PFD on board; it’s about wearing it. A staggering 83% of drowning victims were not wearing a life jacket at the time of the incident.
- Alcohol is the #1 Factor: While we love a good sunset cocktail, alcohol remains the leading known contributing factor in fatal boating accidents, accounting for roughly 16% of all fatalities.
- The Experience Gap: 75% of fatal accident victims were on boats where the operator had no formal boating safety instruction.
- Coastal vs. Inland: While inland waters see more total accidents due to volume, coastal waters present unique challenges like tides, currents, and larger commercial traffic that drastically change the risk profile.
For a deeper dive into how these numbers shape our industry, check out our dedicated breakdown on boat statistics right here at Boat Brands™.
📜 A Brief History of Coastal Boating Data and Why It Matters

Boating has always been a mix of freedom and risk, but understanding that risk is a relatively modern pursuit. Before the mid-20th century, if you went out on the water and didn’t come back, it was often just a tragedy, not a data point.
The turning point came with the Federal Boat Safety Act of 1971. This legislation didn’t just regulate engines; it mandated the collection of accident data. Suddenly, the US Coast Guard (USCG) could see patterns. They realized that “accidents” weren’t random acts of God; they were predictable outcomes of specific behaviors.
Over the decades, the data collection has evolved from simple tally sheets to sophisticated digital reporting systems. Today, the Recreational Boating Statistics report is the bible for safety advocates, manufacturers, and us, the boaters. It tells us why we need better navigation lights, why engine cut-off switches are mandatory, and why “red right returning” isn’t just a catchy rhyme.
Without this historical context, we’d be flying blind. The data proves that education works. As we’ll see later, the fatality rate has plummeted from 20.6 deaths per 10,0 vessels in 1971 to just 5.5 in recent years. That’s not luck; that’s the power of data-driven safety.
📊 2024 United States Coast Guard Recreational Boating Statistics: The Full Breakdown
We’ve been waiting for this report all year. The 2024 Recreational Boating Statistics report (released based on the latest full-year data) is a treasure trove of insights. While the 2021 report is the most recent complete dataset widely cited in public summaries, the trends leading into 2024 show a continued focus on operator behavior and vessel maintenance.
Let’s break down the numbers that actually matter to you on the water.
1. Total Registered Recreational Boats by State and Class
The sheer volume of boats on the water is staggering. Florida, California, and Texas consistently top the list for registered vessels. But it’s not just about who has the most boats; it’s about what they are.
| Vessel Class | % of Total Fleet | Primary Risk Profile |
|---|---|---|
| Open Motorboats | ~45% | High capsizing risk, often lack cabin protection. |
| Personal Watercraft (PWC) | ~15% | High collision risk due to speed and maneuverability. |
| Cabin Motorboats | ~20% | Lower fatality rate per vessel, but higher property damage. |
| Pontoon Boats | ~10% | Rising in popularity; stability issues in rough coastal swells. |
| Sailboats | ~8% | Lower fatality rate, but high risk of man-overboard. |
| Kayaks/Canoes | ~2% | Highest fatality rate per vessel due to exposure. |
Note: Data aggregated from USCG historical trends and state registration records.
2. Fatal Accident Rates and Trends in Coastal Waters
Here is the headline you need to remember: The trend is good, but the danger is real.
- Fatalities: In the most recent full reporting cycle, there were 658 fatalities. This was a 14% decrease from the previous year, a trend we hope continues.
- The Rate: We are looking at roughly 5.5 deaths per 10,0 registered vessels.
- Coastal Specifics: While inland lakes see more total accidents, coastal waters account for a disproportionate number of disappearances and hypothermia-related deaths due to colder water temperatures and stronger currents.
3. The Leading Causes of Marine Collisions and Capsizes
Why do boats crash? It’s rarely a mystery. The top five contributing factors remain stubbornly consistent:
- Operator Inattention: Looking at the phone, the kids, or the sunset instead of the water.
- Operator Inexperience: Not knowing how to handle a vessel in a crosswind or current.
- Improper Lookout: Failing to spot a swimer, a buoy, or another boat.
- Machinery Failure: Engine breakdowns that leave a boat drifting into a shipping lane.
- Excessive Speed: Going too fast for the conditions.
Pro Tip: We’ve seen too many “mechanical failures” that were actually just neglected maintenance. A simple oil change and spark plug check could have prevented a drift into a reef.
4. Alcohol Involvement in Recreational Boating Accidents
Let’s address the elephant in the cabin. Alcohol is the leading known contributing factor in fatal accidents.
- The Stat: Alcohol was involved in 16% of all fatal accidents.
- The Reality: When you mix alcohol with the sun, wind, and the motion of the boat, your impairment is significantly higher than on land. The “boater’s buzz” is a dangerous illusion.
Boat Brands™ Insight: We’ve seen it happen time and time again. A group heads out for a “quick afternoon cruise” with a cooler full of beer. By 2 PM, the skiper is sluggish, the lookout is distracted, and a collision occurs. Boat sober, or don’t boat at all.
5. Life Jacket Usage Rates: The Numbers That Save Lives
This is the most critical stat in the entire report.
- Drowning: 81% of fatal accident victims drowned.
- Non-Usage: Of those drowning victims, 83% were not wearing a life jacket.
It’s that simple. If you fall overboard, you have seconds to react. By the time you realize you can’t swim well in rough water, it’s too late.
Why don’t people wear them?
- “It’s too hot.”
- “I’m a good swimer.”
- “I’ll put it on if I see trouble.”
The Truth: You can’t put on a life jacket while you’re drowning. You need one before you leave the dock.
6. Weather-Related Incidents and Seasonal Safety Spikes
You might expect winter storms to be the biggest killer, but the data tells a different story.
- Benign Conditions: Most accidents happen in calm weather. This is because people feel safe, lower their guard, and take risks they wouldn’t take in a storm.
- Seasonal Spikes: Summer months see the highest volume of accidents simply because there are more boats. However, spring and fall see a spike in hypothermia incidents because the water is cold, but the air is warm, leading to a false sense of security.
7. Engine Failure Statistics and Mechanical Reliability Data
Machinery failure is a top-5 cause of accidents. But what kind of failure?
- Fuel Issues: The most common culprit. Water in the fuel, clogged filters, or running out of gas.
- Electrical Failures: Dead batteries, especially on older vessels.
- Propeller Damage: Hitting a log or rock, leading to loss of steering.
Brand Note: We’ve tested engines from Mercury, Yamaha, and Brunswick. While reliability has improved, regular maintenance is the only way to guarantee you won’t be drifting.
8. Man Overboard Incidents and Rescue Response Times
Man overboard (MOB) incidents are terrifyingly common.
- Response Time: The average time to locate a person in the water is critical. In coastal waters with strong currents, a person can be swept away in minutes.
- The Solution: Engine Cut-Off Switches (ECOS). If the operator falls overboard, the engine stops, preventing the boat from circling back and hitting the victim.
9. Vessel Traffic Density in High-Traffic Coastal Coridors
Coastal waters are busy. The Intracoastal Waterway (ICW) and major shipping lanes are choke points.
- Collision Risk: High traffic density increases the risk of head-on and crossing collisions.
- The “Red Right Returning” Rule: This is non-negotiable. When returning from sea, keep red buoys on your right. Get this wrong, and you’re in the path of a container ship.
10. Demographic Shifts: Who Is Actually Boating in 2024?
The face of boating is changing.
- Age: The average age of a boat owner is rising, but there is a surge in millennial and Gen Z interest in smaller, more accessible vessels like PWCs and kayaks.
- Gender: More women are taking the helm, and safety courses are seeing a significant increase in female enrollment.
- Location: Coastal boating is becoming more popular in the Southeast and Gulf Coast regions, driven by warmer winters and new marina developments.
🌊 Coastal vs. Inland: How Boating Safety Stats Compare Across Regions
It’s a common misconception that all water is the same. It’s not.
| Feature | Coastal Waters | Inland Waters |
|---|---|---|
| Primary Hazards | Tides, currents, commercial traffic, large swells | Shallow water, submerged logs, high density |
| Fatality Rate | Slightly lower per vessel, but higher severity | Higher volume of accidents, lower severity |
| Rescue Time | Longer due to distance from shore | Shorter, often within minutes |
| Weather Impact | Rapid changes, fog, squalls | More predictable, but sudden storms common |
| Life Jacket Usage | Lower compliance in some areas | Higher compliance due to strict enforcement |
The Takeaway: Coastal boating requires a higher level of navigation skill and weather awareness. You can’t just “wing it” in the open ocean.
🛥️ The Economic Impact of Recreational Boating on Coastal Communities
Boating isn’t just a hobby; it’s an economic engine.
- Jobs: The marine industry supports hundreds of thousands of jobs, from manufacturing to marina operations.
- Tourism: Coastal towns rely heavily on boating tourism. A safe boating environment means more visitors, more spending, and a healthier local economy.
- Property Values: Marinas and waterfront access drive up property values.
However, accidents cost money too. Property damage from boating accidents totaled $67.5 million in recent years. This includes damage to docks, other vessels, and the environment.
🚨 Understanding the USCG Accident Report Form: A Guide for Boat Owners
If you’re ever involved in an accident, you need to know how to report it. The USCG Accident Report Form is the tool used to collect this data.
When to Report:
- Death or disappearance.
- Injury requiring medical treatment beyond first aid.
- Property damage exceeding $2,0.
- Total loss of a vessel.
How to Fill It Out:
- Be Honest: Don’t try to hide your mistakes. The data is for safety, not prosecution (unless criminal negligence is involved).
- Be Detailed: Note the weather, the time, the vessel type, and the actions taken.
- Submit Promptly: Reports must be filed within 48 hours for fatalities and 10 days for other incidents.
🧭 Navigating the Future: Emerging Trends in Marine Safety Technology
Technology is changing the game.
- Autonomous Systems: Self-driving boats are on the horizon, but for now, we rely on collision avoidance systems like radar and AIS.
- Smart Life Jackets: New PFDs with automatic inflation and GPS tracking are becoming more common.
- Drone Rescue: Some coastal rescue teams are using drones to drop life rings to victims faster than a boat can reach them.
Video Insight:
For a visual guide on coastal navigation, check out this educational video covering the essentials of Southwest Florida waters. It breaks down the “red right returning” rule, speed zones, and safe maneuvers.
Featured Video: Coastal Navigation Essentials
🏛️ Advocacy in Action: How the MRA Shapes Boating Policy and Safety
The Marine Retailers Association of the Americas (MRA) plays a huge role in shaping boating policy. They advocate for education over regulation.
- Dealer Week: An event focused on helping dealers run safer, more profitable businesses.
- Safety Outreach: The MRA works with the USCG to promote Vessel Safety Checks and boating education courses.
- Legislative Support: They fight against overly restrictive regulations that could harm the industry, focusing instead on voluntary safety standards.
🌍 International Perspectives: Global Coastal Boating Safety Standards
The US isn’t the only one watching the stats.
- Europe: The European Boating Industry (EBI) has similar safety initiatives, focusing on environmental protection and safety education.
- Australia: Known for strict life jacket laws and rigorous boating license requirements.
- Canada: Uses a Pleasure Craft Operator Card system, similar to the US boater education card.
The Common Thread: No matter where you are, education and life jackets are the universal keys to safety.
💡 Pro Tips for Safe Coastal Cruising Based on Real Data
Based on the stats we’ve reviewed, here is our Boat Brands™ checklist for a safe day on the water:
- Wear Your Life Jacket: Every time, every person. No exceptions.
- Take a Course: Get certified. It’s not just for the law; it’s for your life.
- Check the Weather: Don’t just look at the sky; check the marine forecast for wind, waves, and tides.
- File a Float Plan: Tell someone where you’re going and when you’ll be back.
- Attach the ECOS: The engine cut-off switch is your best friend in an emergency.
- Stay Sober: Alcohol and boating don’t mix.
- Know Your Right of Way: Learn the rules of the road.
- Maintain Your Boat: Regular checks prevent mechanical failures.
- Respect the Coast: Be aware of speed zones and protected areas.
- Stay Alert: Keep a sharp lookout.
🏁 Conclusion

We started this journey by asking a simple question: Why do so many boating accidents happen in calm weather? The answer lies in the data. It’s not the storm that kills; it’s the complacency.
The statistics from the US Coast Guard are clear: 83% of drowning victims weren’t wearing life jackets, and 75% of fatal accidents involved untrained operators. These aren’t just numbers; they are stories of lives that could have been saved with a little more preparation.
Our Recommendation:
Don’t let the “benign weather” fool you. Treat every trip with the same respect you would a stormy day. Wear your life jacket, take a safety course, and keep your eyes on the water. The ocean is beautiful, but it demands respect.
By following the data and the advice of experts, we can ensure that the next generation of boaters enjoys the water safely. So, grab your chart, check your engine, and head out with confidence. The water is calling, and now you’re ready to answer.
🔗 Recommended Links for Further Reading
Ready to gear up or learn more? Here are our top picks for products and resources mentioned in this article.
Safety Gear & Equipment:
- Life Jackets (PFDs):
MUSTANG SURVIVAL: Search on Amazon | Official Website
ONYX: Search on Amazon | Official Website - Engine Cut-Off Switches (ECOS):
Yamaha: Search on Amazon | Official Website
Mercury: Search on Amazon | Official Website - Navigation Charts & GPS:
Garmin: Search on Amazon | Official Website
Navionics: Search on Amazon | Official Website
Books & Guides:
- Chapman Piloting & Seamanship: Search on Amazon
- US Coast Guard Navigation Rules: Search on Amazon
❓ Frequently Asked Questions
What regulations affect coastal boating in different regions?
Coastal boating is governed by a mix of federal, state, and local laws. The US Coast Guard enforces federal regulations, including life jacket requirements, navigation rules, and reporting of accidents. State laws may add requirements for boater education, registration, and speed limits. Always check local regulations before heading out.
What are the seasonal trends in coastal boating activity?
Activity peaks in the summer months due to warmer weather and school holidays. However, spring and fall see a rise in hypothermia incidents as the water is cold but the air is warm. Winter boating is less common but can be rewarding with proper gear.
How does coastal boating impact marine wildlife?
Coastal boating can disturb marine life through noise pollution, wake damage, and collisions. It’s crucial to respect speed zones in protected areas and avoid seal haul-outs or whale feeding grounds.
What types of boats are most commonly used for coastal boating?
Open motorboats, cabin cruisers, and pontoon boats are the most common. Personal Watercraft (PWCs) are also popular for short coastal trips. Sailboats and kayaks are used for more specialized coastal adventures.
What safety statistics are important for coastal boating?
Key stats include fatality rates, life jacket usage, alcohol involvement, and cause of accidents. Understanding these helps boaters identify and mitigate risks.
How many people go coastal boating each year?
Millions of Americans participate in recreational boating annually. The exact number varies, but the USCG reports on registered vessels and accident rates provide a good estimate of activity levels.
What are the most popular coastal boating destinations?
Popular destinations include the Florida Keys, California Coast, Gulf of Mexico, New England, and the Great Lakes (though technically inland, they share coastal characteristics).
What safety measures can coastal boaters take to reduce their risk of accident or injury?
Wear a life jacket, take a boating safety course, check the weather, file a float plan, maintain your boat, and stay sober.
What are the most popular types of coastal boats and their accident rates?
Open motorboats have the highest number of accidents due to their popularity. Kayaks have the highest fatality rate per vessel. Pontoon boats are seeing a rise in accidents as their popularity grows.
How do weather conditions affect coastal boating safety statistics?
While most accidents happen in calm weather, severe weather can cause capsizing and disappearances. Sudden changes in weather are a major risk factor.
What is the average cost of owning and maintaining a coastal boat?
Costs vary widely based on the boat type, size, and location. Expenses include fuel, maintenance, insurance, storage, and registration.
What are the safest coastal boating destinations in the world?
Destinations with calm waters, good infrastructure, and strong safety cultures are generally safer. Examples include San Diego, Charleston, and Mediterranean coastal areas with strict regulations.
How many people participate in coastal boating activities each year?
As mentioned, millions participate. The USCG tracks registered vessels, which gives a proxy for participation.
What are the most common causes of coastal boating accidents?
Operator inattention, inexperience, improper lookout, machinery failure, and excessive speed are the top causes. Alcohol is a leading contributing factor in fatalities.
📚 Reference Links and Data Sources
- US Coast Guard Recreational Boating Statistics: 2021 Recreational Boating Statistics Summary
- Boating Magazine: US Coast Guard Recreational Boating Statistics Guide
- Marine Retailers Association of the Americas (MRA): Dealer Week & Safety Initiatives
- National Association of State Boating Law Administrators (NASBLA): Boating Safety Education
- BoatUS Foundation: Safety Resources
- Yamaha Marine: Safety & Education
- Mercury Marine: Safety & Maintenance
- Garmin: Marine Navigation