Support our educational content for free when you purchase through links on our site. Learn more
What Percentage of Deaths Are Caused by Boating? ⚓

There isn’t one universal percentage for what share of all deaths are caused by boating—the answer depends on the country, year, and how deaths are counted. In the U.S., the Coast Guard recorded 556 recreational-boating fatalities in 2024; that figure describes boating deaths, not boating’s share of every death from every cause.
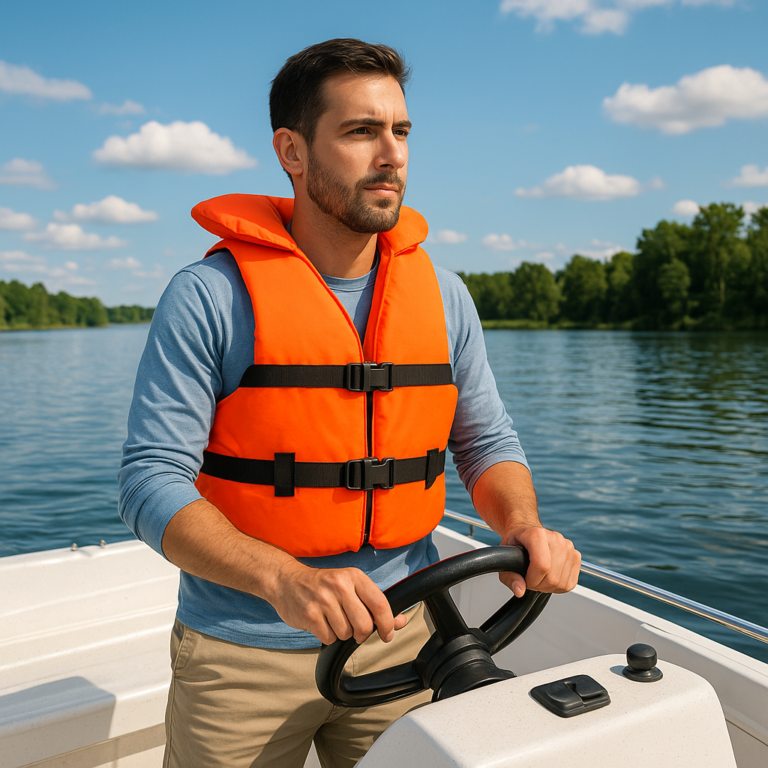
The more useful safety statistic is closer to the waterline: about three-quarters of recreational boating fatalities involve drowning, and most drowning victims were not wearing a life jacket, according to Boat-Ed’s summary of the Coast Guard’s 2024 data. We’ve seen how quickly a calm outing can change when someone slips overboard—so the life jacket you wear beats the one stashed under a seat every time.
Key Takeaways
- There’s no single universal percentage of all deaths caused by boating; the result depends on the location, year, and denominator.
- The Coast Guard recorded 556 U.S. recreational-boating fatalities in 2024.
- Drowning accounts for about three-quarters of recreational boating deaths.
- Wearing a properly fitted life jacket, staying sober at the helm, and checking conditions are practical ways to reduce risk.
- Check the source and its definitions: boating deaths, drowning deaths, and fatal incidents are different measures.
Table of Contents
- ⚡️ Quick Tips and Facts
- 📊 What Percentage of Deaths Are Caused by Boating?
- Boating Deaths as a Share of All Accidental Deaths
- Why the Percentage Changes by Country, Year, and Data Source
- 🧭 Background: How Boating Fatalities Are Counted
- What Counts as a Boating Accident or Fatality?
- Recreational Boating Versus Commercial Boating
- 📈 U.S. Recreational Boating Death Statistics
- Fatalities, Accidents, and Injuries at a Glance
- Boating Deaths by Age and Experience
- Where Boating Fatalities Happen
- ⚠️ Leading Causes of Boating Deaths
- Drowning and Not Wearing a Life Jacket
- Alcohol, Drugs, and Boating Under the Influence
- Capsizing, Falls Overboard, and Collisions
- Bad Weather, Cold Water, and Hypothermia
- Operator Inattention, Inexperience, and Excessive Speed
- 🔎 Who Is Most at Risk of a Fatal Boating Accident?
- Risk Factors for Boat Operators and Passengers
- How Boat Type, Waterway, and Conditions Affect Risk
- 🛟 How to Reduce the Risk of Boating Deaths
- Choose and Wear the Right Life Jacket
- Take a Boating Safety Course
- Avoid Alcohol and Assign a Sober Operator
- Check Weather, Water, and Vessel Conditions
- File a Float Plan and Carry Emergency Gear
- 🧮 How to Interpret Boating Fatality Percentages
- Percentage of All Deaths Versus Risk Per Boating Trip
- Why Raw Fatality Totals Can Be Misleading
- 📚 Boating Safety Data, Reports, and Resources
- Official Statistics and Fatality Reports
- Safety Guides, Infographics, and Training
- Boating Injury and Fatality Data by Age
- ✅ Conclusion
- 🔗 Recommended Links
- ❓ FAQ
- What percentage of accidental deaths happen while boating?
- What is the most common cause of boating deaths?
- What percentage of boating fatalities involve drowning?
- How many boating deaths involve people not wearing life jackets?
- Does alcohol increase the risk of a fatal boating accident?
- Are boating deaths becoming more or less common?
- Where can I find official boating fatality statistics?
- 📖 Reference Links
Table of Contents
- ⚡️ Quick Tips and Facts
- 📊 What Percentage of Deaths Are Caused by Boating?
- Boating Deaths as a Share of All Accidental Deaths
- Why the Percentage Changes by Country, Year, and Data Source
- 🧭 Background: How Boating Fatalities Are Counted
- What Counts as a Boating Accident or Fatality?
- Recreational Boating Versus Commercial Boating
- 📈 U.S. Recreational Boating Death Statistics
- Fatalities, Accidents, and Injuries at a Glance
- Boating Deaths by Age and Experience
- Where Boating Fatalities Happen
- ⚠️ Leading Causes of Boating Deaths
- Drowning and Not Wearing a Life Jacket
- Alcohol, Drugs, and Boating Under the Influence
- Capsizing, Falls Overboard, and Collisions
- Bad Weather, Cold Water, and Hypothermia
- Operator Inattention, Inexperience, and Excessive Speed
- 🔎 Who Is Most at Risk of a Fatal Boating Accident?
- Risk Factors for Boat Operators and Passengers
- How Boat Type, Waterway, and Conditions Affect Risk
- 🛟 How to Reduce the Risk of Boating Deaths
- Choose and Wear the Right Life Jacket
- Take a Boating Safety Course
- Avoid Alcohol and Assign a Sober Operator
- Check Weather, Water, and Vessel Conditions
- File a Float Plan and Carry Emergency Gear
- 🧮 How to Interpret Boating Fatality Percentages
- Percentage of All Deaths Versus Risk Per Boating Trip
- Why Raw Fatality Totals Can Be Misleading
- 📚 Boating Safety Data, Reports, and Resources
- Official Statistics and Fatality Reports
- Safety Guides, Infographics, and Training
- Boating Injury and Fatality Data by Age
- ✅ Conclusion
- 🔗 Recommended Links
- ❓ FAQ
- What percentage of accidental deaths happen while boating?
- What is the most common cause of boating deaths?
- What percentage of boating fatalities involve drowning?
- How many boating deaths involve people not wearing life jackets?
- Does alcohol increase the risk of a fatal boating accident?
- Are boating deaths becoming more or less common?
- Where can I find official boating fatality statistics?
- 📖 Reference Links
⚡️ Quick Tips and Facts
If you’re searching “what percentage of deaths are caused by boating?”, the honest answer is: there isn’t one universal percentage. It depends on the country, year, and whether you mean all deaths, accidental deaths, or deaths among boating-accident victims. U.S. Coast Guard reports usually describe boating deaths as a count and as a share of reported boating accidents, not as a share of every death from every cause.
For context, the Coast Guard recorded 556 U.S. recreational-boating fatalities in 2024, alongside 3,887 reported incidents, according to Boat-Ed’s summary of the 2024 Coast Guard report. That tells us how many people died in reported recreational boating incidents; it does not mean boating caused a particular percentage of all U.S. deaths.
For broader context on participation and industry data, see our 🚤 Recreational Boating Industry Statistics: 2026 Market Truths. And if you’re browsing our Guide to boating, keep these practical facts aboard:
| Quick fact | What it means for you |
|---|---|
| About three-quarters of recreational boating fatalities are drownings | The exact share varies by report year; the Coast Guard’s official statistics are the best source for current figures. |
| Most drowning victims were not wearing a life jacket | In the 2024 figures summarized by Boat-Ed, 87% of drowning victims were not wearing one. |
| Alcohol is a major preventable factor | Boat-Ed reports alcohol was involved in 20% of 2024 boating fatalities. |
| The denominator matters | “Percentage of all deaths” and “percentage of boating deaths caused by drowning” answer entirely different questions. |
| A wearable life jacket works best when worn | Stowed under a seat, a PFD is more of a hopeful accessory than a safety plan. |
Our crew’s short version: Wear a properly fitted life jacket, keep the operator sober, check conditions before departure, and tell someone ashore where you’re going and when you expect to return. Those habits address the risks behind a sobering share of boating fatalities.
📊 What Percentage of Deaths Are Caused by Boating?
Boating Deaths as a Share of All Accidental Deaths
There is no standard, widely published percentage answering what share of all deaths are caused by boating. To calculate one, you would need a defined population and period, then compare boating fatalities with all deaths in that same population and period.
The result would be a very small fraction of all deaths in a large country, but quoting a precise percentage without specifying the year, location, and definition would be misleading. The U.S. Coast Guard’s recreational-boating reports count deaths tied to reported recreational boating accidents; national vital-statistics data group deaths differently. Those systems don’t automatically supply a neat, directly comparable “boating share of all deaths.”
It helps to separate three questions:
| Question | What the percentage describes |
|---|---|
| What share of all deaths are caused by boating? | Boating fatalities divided by all deaths in the same place and period. |
| What share of boating-accident deaths are drownings? | Drowning fatalities divided by all boating fatalities. |
| What share of reported boating accidents are fatal? | Accidents involving a death divided by reported boating accidents. |
These are not interchangeable. For example, Boat-Ed’s report on 2024 Coast Guard statistics says approximately 75% of recreational boating deaths were caused by drowning. That means drowning is a leading cause within boating deaths. It does not mean boating accounts for 75% of all deaths.
Why the Percentage Changes by Country, Year, and Data Source
The number can shift with:
- Geography: U.S. recreational boating statistics are not global boating statistics.
- Time period: Fatalities vary from year to year with weather, boating participation, and other conditions.
- Scope: Recreational, commercial, and occupational vessel incidents may be counted separately.
- Reporting rules: A statistic may include only reported accidents or may use death-certificate records.
- Denominator: All deaths, accidental deaths, boating incidents, or boating fatalities produce different percentages.
The U.S. Coast Guard’s annual boating accident reports are the most relevant source for U.S. recreational-boating trends. For the broader denominator of all deaths, consult the CDC’s mortality data and statistics and confirm the matching geography and year.
That distinction also explains why an older infographic and a current annual report can both be correct while showing different proportions. A 2013 fact sheet from the Children’s Safety Network reported that 77% of boating deaths with a known cause were drownings. More recent summaries put the drowning share around three-quarters. Different years and different “known cause” subsets—not necessarily conflicting evidence—can explain the gap.
🧭 Background: How Boating Fatalities Are Counted

What Counts as a Boating Accident or Fatality?
A boating fatality generally refers to a death associated with a boating accident under the reporting system used. The precise scope matters: a person may die after drowning, a collision, a fall overboard, or another event connected to vessel operation.
The Coast Guard’s statistics are focused on reportable recreational boating accidents. The Coast Guard explains its reporting requirements and data in its Boating Accident Report Database and statistics materials. State agencies and other organizations may also collect incident information, and their definitions or reporting coverage may differ.
When you read a statistic, check:
- Who collected the data?
- Which boats and waterways are included?
- Does the total count deaths, incidents, or both?
- Are percentages based on all cases or only cases with known information?
- Which year does the data describe?
That last detail matters more than it might seem. A percentage calculated only from cases with known life-jacket use is not necessarily the same as a percentage calculated from every fatality.
Recreational Boating Versus Commercial Boating
Recreational boating usually means activities such as fishing, watersports, cruising, and pleasure trips. Commercial and occupational vessel incidents involve different work environments, vessel types, exposure, and reporting systems.
So when a source says “boating deaths,” don’t assume it includes every death involving a vessel. The Coast Guard’s annual recreational-boating report is the right fit for ordinary U.S. leisure boating questions; workplace and commercial-vessel safety may be covered by other federal or state data.
Our Boat Industry News and Boat Manufacturers coverage may help you understand the industry, but safety statistics should always be checked against the scope of the original report.
📈 U.S. Recreational Boating Death Statistics
Fatalities, Accidents, and Injuries at a Glance
The table below illustrates why the year belongs next to every statistic. For 2024, Boat-Ed’s summary of the Coast Guard report lists 556 fatalities and 3,887 reported boating incidents. For comparison, a 2013 Children’s Safety Network infographic cited 560 deaths and 2,620 injuries for that year. These are different years and reporting snapshots, not a direct year-to-year comparison of risk.
| Data point | Reported figure | Important context |
|---|---|---|
| U.S. recreational-boating fatalities, 2024 | 556 | Annual fatality count summarized from Coast Guard data. |
| Reported boating incidents, 2024 | 3,887 | Incidents, not individual deaths. |
| Boating deaths, 2013 | 560 | Historical figure from the Children’s Safety Network infographic. |
| Boating injuries, 2013 | 2,620 | Historical figure; do not compare directly with a newer year without checking definitions and coverage. |
These figures do not tell you the percentage of all deaths caused by boating. They describe boating fatalities and incidents. For current year-by-year detail, use the Coast Guard’s official annual reports.
Boating Deaths by Age and Experience
Age statistics can help identify who needs extra support, but they should not be mistaken for an individual’s risk of dying on a particular trip.
In its 2013 analysis, the Children’s Safety Network reported that, among boating deaths with known age, 4% were ages 0–12, 5% were ages 13–19, and 91% were age 20 or older. Among injuries with known age, children and teens made up a larger share: 7% were ages 0–12 and 17% were ages 13–19.
| Age group | Share of 2013 deaths with known age | Share of 2013 injuries with known age |
|---|---|---|
| Ages 0–12 | 4% | 7% |
| Ages 13–19 | 5% | 17% |
| Ages 20+ | 91% | 76% |
The practical takeaway is not “adults don’t need supervision.” It’s that every passenger needs a fitted life jacket and a clear safety briefing, while children need close, continuous attention near the water. The Coast Guard’s life-jacket guidance and boating safety resources offer practical advice.
Experience matters, too. In the 2024 figures summarized by Boat-Ed, 70% of deaths occurred on boats whose operators had not completed a safety course. That doesn’t prove a course alone would have prevented each death, but it supports a clear recommendation: learn the rules and practice decisions before a busy day on the water.
Where Boating Fatalities Happen
Fatal incidents happen on a range of waters, from rivers and lakes to coastal and offshore waters. The circumstances vary with vessel type, traffic, weather, current, water temperature, and distance from help.
A calm-looking lake can still pose risks: cold water, submerged hazards, sudden wind, and a long swim to shore. Coastal boating adds tides, surf, changing forecasts, and navigation challenges. Don’t use “it’s just a short trip” as a substitute for preparation.
Before heading out, check local conditions and notices through official sources such as the National Weather Service marine forecasts and the Coast Guard’s Boating Safety resources.
⚠️ Leading Causes of Boating Deaths
Drowning and Not Wearing a Life Jacket
Drowning is the leading cause of recreational boating deaths. Boat-Ed’s summary of 2024 Coast Guard statistics reports that approximately 75% of recreational boating deaths were drownings, and that 87% of drowning victims were not wearing a life jacket.
An older Children’s Safety Network infographic found drowning accounted for 77% of deaths with a known cause in 2013. Among drowning deaths with known life-jacket use, 84% of victims were not wearing one. The figures differ by year and by which cases had complete information; both point to the same practical truth: wearing a life jacket is one of the most direct ways to reduce drowning risk.
A life jacket is not magic armor. It must be:
- U.S. Coast Guard-approved for its intended use.
- The right size for the wearer.
- In good condition and properly fastened.
- Worn before an emergency, not hunted for after someone falls in.
Our crew has seen people treat PFDs like spare anchors: carefully stowed and completely unavailable when needed. Keep yours on.
Alcohol, Drugs, and Boating Under the Influence
Alcohol can impair judgment, balance, coordination, and reaction time. On the water, sun, wind, motion, vibration, noise, and dehydration can compound fatigue and impairment. The U.S. Coast Guard’s boating safety guidance warns against boating under the influence.
Boat-Ed’s 2024 statistics summary reports alcohol was involved in 20% of boating fatalities, accounting for 92 deaths. The 2013 Children’s Safety Network infographic identified alcohol use as a contributing factor in 16% of deaths where a primary contributing factor was known. These figures use different years and data subsets, so they should not be treated as contradictory.
Our recommendation is simple: the operator stays sober. Assign the designated operator before the first drink, and don’t let anyone who is impaired take the helm. If the person in charge appears intoxicated, don’t board or continue the trip with them operating.
Capsizing, Falls Overboard, and Collisions
Capsizing, falls overboard, and collisions can quickly turn a routine outing into a rescue situation. They may happen after a sudden wake, a shift in passenger weight, a misjudged turn, poor lookout, or changing weather.
Before departure, brief everyone on three basics:
- Stay seated when the boat is moving, unless the operator says otherwise.
- Keep weight low and balanced, and avoid sudden movement.
- Know where life jackets and throwable flotation devices are located.
If someone falls overboard, keep them in sight, have a passenger point continuously, reduce speed, and throw flotation. Follow your vessel’s emergency plan and call for help when needed. The U.S. Coast Guard’s boating safety resources cover equipment and emergency preparedness.
Bad Weather, Cold Water, and Hypothermia
Weather can change faster than a pleasant forecast suggests. Wind can build waves, reduce visibility, and make returning to shore much harder. Cold water can impair movement and judgment; a person in the water may be in danger even when the air feels comfortable.
Check a marine forecast before departure and keep monitoring conditions. The National Weather Service marine forecast page provides official forecasts and advisories. If conditions worsen, head for a safe landing before the trip becomes a contest with the weather.
Children need particular attention in cold conditions. The Children’s Safety Network advises keeping children warm and supervising them closely. Pack suitable layers, protect them from wind and spray, and make sure their life jackets fit over the clothing they’re wearing.
Operator Inattention, Inexperience, and Excessive Speed
Inattention, poor lookout, and inexperience can make hazards harder to spot and leave less time to respond. In its 2013 data, the Children’s Safety Network listed operator inattention at 12% and hazardous waters at 11% among known primary contributing factors. Boat-Ed’s 2024 summary also identifies operator inattention, improper lookout, and inexperience among leading contributing factors.
The fixes are refreshingly unglamorous:
- Keep a proper lookout.
- Slow down when visibility, traffic, or water conditions demand it.
- Avoid distractions at the helm.
- Learn local navigation rules.
- Don’t let an inexperienced operator take charge without appropriate supervision.
Our Boat Buying Guide can help you compare vessel types, but whatever you buy, good judgment remains standard equipment.
🔎 Who Is Most at Risk of a Fatal Boating Accident?
Risk Factors for Boat Operators and Passengers
Risk is shaped by conditions and choices, not simply by whether someone is a “new boater” or an “old hand.” A confident operator can still be caught by poor weather or distracted by passengers. A first-time passenger can be safer than an experienced one if they wear a PFD and follow instructions.
Risk tends to rise when people:
- Don’t wear life jackets.
- Operate after drinking or using drugs.
- Lack boating-safety education.
- Ignore weather, traffic, or water conditions.
- Allow passengers to move around while underway.
- Fail to carry or understand required safety equipment.
The National Safe Boating Council and the Coast Guard’s recreational-boater resources provide guidance for operators and passengers alike.
How Boat Type, Waterway, and Conditions Affect Risk
A small open boat, a personal watercraft, a pontoon, and an offshore vessel present different handling and exposure risks. So do a narrow river, a crowded inland lake, and exposed coastal water. There’s no single “safest boat” answer independent of your use, skill, maintenance, and conditions.
| Factor | How it can affect safety | What to do |
|---|---|---|
| Boat size and design | Stability, capacity, and handling differ by hull and vessel type. | Follow the capacity plate and manufacturer’s operating guidance. |
| Waterway | Current, tides, obstacles, traffic, and distance to shore vary. | Learn local hazards and route conditions before launch. |
| Weather and water temperature | Wind, waves, lightning, and cold water can rapidly increase danger. | Check forecasts and turn back early if conditions deteriorate. |
| Passenger load | Overloading or uneven weight can compromise stability. | Stay within capacity and distribute people and gear as directed. |
| Operator familiarity | Unfamiliar controls or navigation can slow reactions. | Practice and take a recognized safety course. |
When comparing boats, look beyond seating and storage. Read our Boat Brands and Boat Manufacturers coverage, then check the specific manufacturer’s manual and safety information.
🛟 How to Reduce the Risk of Boating Deaths
Choose and Wear the Right Life Jacket
Use a U.S. Coast Guard-approved wearable life jacket that fits each person. Check the label for the appropriate activity and size, inspect straps and flotation material, and make sure children’s jackets are correctly sized.
Step by step:
- Check the label for approval and intended use.
- Choose the correct size for each wearer; adult jackets are not suitable substitutes for child-sized PFDs.
- Inspect condition for tears, damaged buckles, mildew, or other deterioration.
- Fasten it properly and test the fit before leaving the dock.
- Wear it underway, rather than assuming you’ll have time to put it on later.
See the Coast Guard’s life-jacket wear guidance and U.S. Coast Guard-approved equipment information.
Take a Boating Safety Course
A safety course covers navigation rules, weather, equipment, emergency response, and safe operation. Requirements vary by state and sometimes by operator age or vessel type, so check your state’s boating agency before taking the helm.
A useful plan:
- Check your state’s operator education requirements.
- Choose a recognized course accepted by your state.
- Complete the learning material and exam.
- Keep proof of completion accessible.
- Refresh what you learned before a new type of trip or vessel.
The National Association of State Boating Law Administrators provides state boating information, while Boat-Ed offers state-specific online courses. A course won’t make every emergency predictable, but it gives you a better chance of recognizing trouble early.
Avoid Alcohol and Assign a Sober Operator
Before launching, name the operator who will stay sober. Make that decision explicit rather than leaving it to whoever feels “most fine” later.
- Keep alcohol away from the helm.
- Don’t allow an impaired operator to take control.
- Account for fatigue, heat, motion, and medication as well as alcohol.
- If anyone questions the operator’s condition, stop and reassess.
The Coast Guard identifies boating under the influence as a serious safety hazard. Review its boating safety guidance and check current federal and state laws for your waterway.
Check Weather, Water, and Vessel Conditions
A proper pre-departure check takes minutes and can save the day.
- Check the marine forecast and any local advisories.
- Look at wind, waves, visibility, and water temperature, not only air temperature.
- Inspect fuel, steering, engine, lights, and communications.
- Confirm the vessel’s capacity and secure loose gear.
- Choose a turn-back point before conditions deteriorate.
Use the National Weather Service marine forecasts and local boating-agency notices. If a forecast looks marginal, the boat will still be there tomorrow. The weather, less reliably, may not cooperate.
File a Float Plan and Carry Emergency Gear
Tell someone ashore where you plan to go and when you expect to return. Include the boat description, passenger count, route, and contact information. A float plan helps others know when and where to raise the alarm if you don’t check in.
Also confirm the required equipment for your vessel and waterway. Depending on vessel and operating area, that may include wearable PFDs, a throwable device, fire extinguisher, sound-producing device, navigation lights, and visual distress signals. Requirements vary; check the Coast Guard’s recreational-boater safety information and your state’s regulations.
A quick passenger briefing should cover:
- Where life jackets are and how they fasten.
- How to call for help and where communication equipment is.
- What to do if someone falls overboard.
- How to stop the engine or alert the operator in an emergency.
- Where the first-aid kit and fire extinguisher are located.
🧮 How to Interpret Boating Fatality Percentages
Percentage of All Deaths Versus Risk Per Boating Trip
A percentage of all deaths tells you how boating fatalities compare with deaths from all causes in a defined population. It does not tell you the chance of dying during a single boating trip.
To estimate individual risk, researchers would need a suitable exposure measure, such as the number of trips, hours underway, or people participating. A raw annual death count alone can’t provide that rate.
| Measure | Numerator | Denominator | What it answers |
|---|---|---|---|
| Share of all deaths | Boating deaths | All deaths in the same population and period | How much boating contributes total mortality |
| Share of boating deaths due to drowning | Drowning deaths in boating incidents | All boating fatalities | What causes death among boating victims |
| Fatality rate per trip | Boating deaths | Number of boating trips | Approximate risk per trip, if good exposure data exist |
| Incident fatality share | Incidents involving a death | Reported boating incidents | How often reported incidents are fatal |
When a headline gives a percentage without explaining the denominator, treat it cautiously. The denominator is the part of the statistic doing the steering.
Why Raw Fatality Totals Can Be Misleading
Annual totals can change because participation changes, reporting improves, weather varies, or the mix of boating activities shifts. A year with more deaths does not automatically mean every individual trip became more dangerous.
Likewise, a decline in fatalities over decades does not mean risk has disappeared. The Children’s Safety Network notes a long-term decline in boating deaths since 1971 and connects progress with safety education, life-jacket use, and attention to unsafe practices and alcohol. That historical trend is encouraging, but the annual Coast Guard report remains the better tool for current-year conditions.
📚 Boating Safety Data, Reports, and Resources
Official Statistics and Fatality Reports
For reliable statistics, start with the source that collected the data:
- U.S. Coast Guard: Boating Accident Statistics — annual recreational-boating reports and related data.
- Centers for Disease Control and Prevention: Mortality Data — U.S. death statistics and vital records information.
- National Weather Service: Marine Forecasts — official marine weather forecasts and advisories.
- National Association of State Boating Law Administrators — state boating-law and education information.
For the specific question “what percentage of all deaths are caused by boating?”, you would need to align Coast Guard boating-fatality figures with mortality data for the same geography and year, while making sure the definitions are comparable. Don’t mix a boating-specific subset from one report with a different population’s all-cause total.
Safety Guides, Infographics, and Training
Useful safety resources include:
- U.S. Coast Guard recreational-boater guidance for equipment, life jackets, and safe operation.
- Children’s Safety Network boating-safety infographic for historical age, cause, and life-jacket figures.
- National Safe Boating Council for boating-safety education and campaigns.
- Boat-Ed safety courses for state-specific online boating education.
- Our Boat Buying Guide for vessel-shopping considerations and our Boat Lifestyle coverage for practical boating topics.
Boat-Ed’s Memorial Day boating safety article highlights holiday-season hazards such as crowded waterways, alcohol, and seasonal inexperience. The same habits matter on an ordinary Tuesday, too.
Boating Injury and Fatality Data by Age
Age breakdowns can be useful for family safety planning, but check the year and number of cases included. The Children’s Safety Network’s 2013 figures, for instance, use only records where age was known: that leaves 553 deaths and 2,486 injuries in its age breakdown.
The same infographic reports that among deaths with known causes, 77% were drownings, 18% were trauma, and 6% were other causes. The rounded figures total 101%, which can happen when percentages are rounded independently. It also reports that among drowning deaths with known life-jacket use, 84% were not wearing a life jacket. Its introductory text gives 82% for a broader summary; this difference likely reflects the subset used for the detailed calculation.
That’s a useful reminder: read the footnotes and denominator, not just the bold percentage.